Access current congestion levels for the world’s top ports with Spire’s Port Congestion Index
 Written by
Spire Global
Having an accurate picture of a ship’s voyage is essential and the start and end of such a voyage happen in ports. When you don’t have dependable congestion data exactly when you need it, precious time and money are at risk, and the ability to make informed decisions can be impaired.
Port congestion is becoming an increasing threat to maritime logistics. With the “just in time” delivery expectation, breaks and delays in the global supply chain are detrimental to all invested parties. It is crucial to understand what the situation is at ports around the globe, as being able to plan a proactive response lessens the impact of a major port closure or congestion. From the perspective of shippers and carriers, there are the day-to-day cost implications from a delay. When stuck at port, even the cargo is affected, as it can miss its connecting transportation, causing further scheduling problems. And of course, let us not forget the effects carbon emissions from idling ships waiting to enter port have on our marine environment.
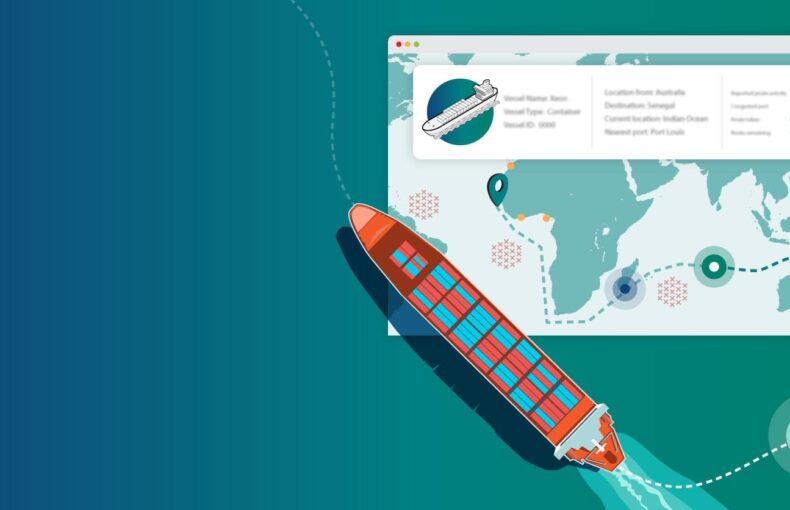
Introducing Spire’s Port Congestion Index
Using Spire’s AIS data we have developed a tool that captures the current congestion levels for the world’s top ports.
Discover Spire’s Port Congestion Index
How we track congestion
With our global geospatial database of ports, anchorage, and terminal polygons, we are able to detect when a ship arrives inside in any of these areas. Immediately an “event” is triggered, whether a port, anchorage, or terminal event.
From this collection of events, we can track all the different kinds of journeys a ship can encounter when arriving near its port of destination:
- In case of congestion, the ship is likely to wait in the anchorage area before reaching the port and then the terminal area.
- In case of no congestion, the ship will directly arrive in the port area and then reach the terminal.
By analyzing all these components, we can derive the delay at terminal for a given vessel, as the time between the first time of detection near the port of destination (whether or not waiting in anchorage) and the time of arrival in the terminal area.
These delays at terminals reflect the daily level of congestion in each port. To get an accurate and robust picture of these levels, these delays are averaged per vessel type on a daily basis. From these delays, we created the Port Congestion Index to measure the degree of congestion inside the port. It takes values between 0 and 1 and corresponds to the normalized average delay in terminal (as the ratio of the daily average delay in terminal to the maximum delay in terminal observed all along the period). High values (>0.6) indicate strong congestion levels, whereas low values (<0.5) indicate weak congestion levels.
We built a daily time series of congestion for each port since the beginning of May 2021. Analyzing their trends and peaks offers insights into the health status of maritime supply chains while detecting potential disruptions.