5 Ways Historical Weather Data will Up Your Maritime Game
 Written by
Sharmain Zain
Content Manager at Spire Weather
The uncertainties of life at sea often witnesses individuals and maritime entities pouring over weather forecast data.
Key stakeholders such as the fleet operations team and the Captain along with the 2nd officer utilise these weather forecast datasets to manage daily maritime operations. However, did you know that they utilise it in combination with another class of weather data? This category of data bears significant importance to the profitability line and yes, we’re referring to none other than historical weather.
If you were unable to join our webinar where our panel of maritime innovation experts discussed the essence and value of historical weather data to the shipping sphere, here are a few key takeaways from it.
How can a balance between on-time delivery, safety and fuel consumption be achieved?
Facilitates network and voyage planning
We live in a complex atmosphere where the only constant is its change and flux. The world is still struggling to comprehend the mysterious forces that influence weather patterns and related events. The smallest change can cause a ripple effect that may echo from one point of the globe to the other. This is one of the reasons why weather forecasts after ten days can be unreliable and cannot serve as a guide for your network planning efforts beyond this time period.
Historical weather data
The network planning team studies historical weather data to identify any potential underlying weather abnormalities in regions that have a high risk sailing factor. This is dependent on the season as well. For instance, the weather in the North Atlantic differs based on whether it’s summer or winter. If the wave is in favour of pushing your vessel towards your targeted location, then you’ll utilise less fuel and effectively reduce your carbon footprint.
Achieves a balance
Container ships sell the promise to deliver precious goods on time. Now, to be true to their brand message, container shipping lines need to calculate the right sailing speed and route.
Their biggest expense is fuel consumption and can range from $50,000 – $200,000 per vessel per day. When added across a fleet of seafaring vehicles, the number can escalate into a mind-boggling, massive figure. Historical weather data can assist in cracking this puzzle and unveiling optimal velocities along with favourable destination paths.
It’s important to note that the way you choose to apply historical weather data will also matter. The shipping sphere has seen an increase in the number of containers lost at sea. In 2020, the One-Apus, a 14000 TEU ship, sailed up the Japanese Kuroshio current and upon entrance into the Pacific, ventured close to a developing depression. This toppled the massive vessel and sent over 1800 containers sinking to the bottom of the sea and fiscally translated into losses worth $200 million.
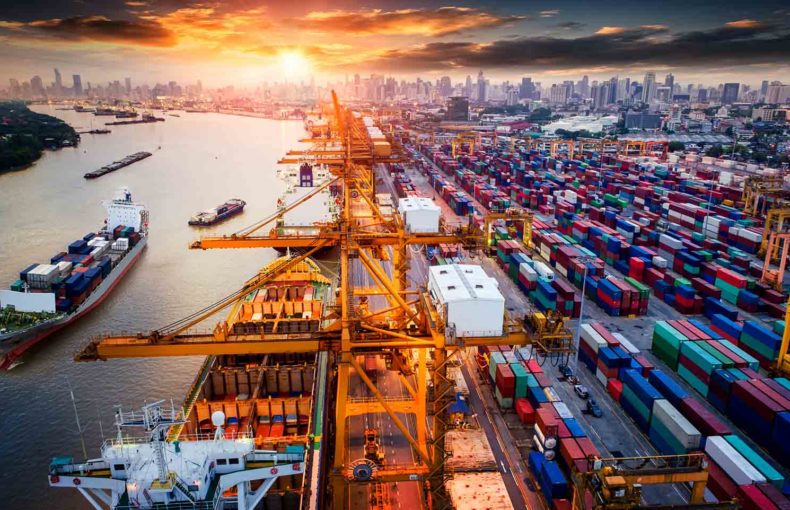
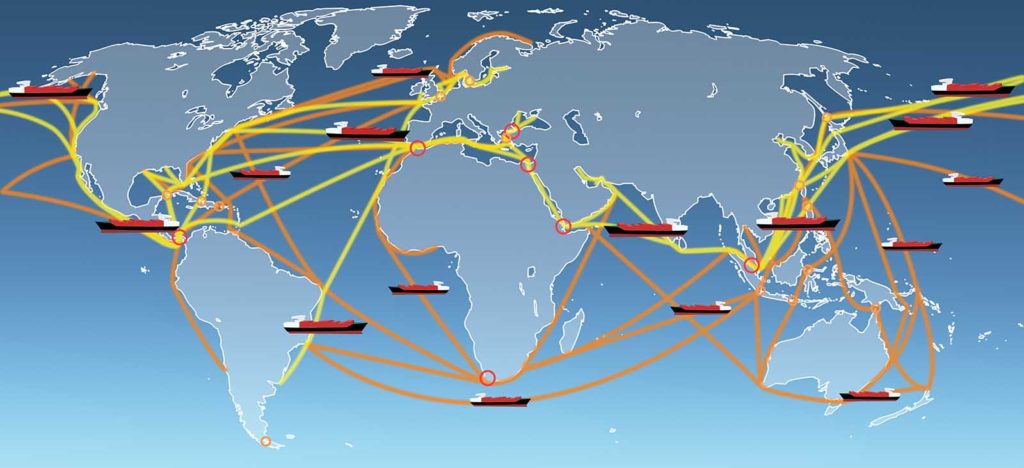
Minimise global supply chain disruptions
Recent global port bottlenecks have only worsened with ports having to close down in Southern China, such as in Yantian & Hong Kong, due to a cyclone, dubbed Kompasu.This is the second major storm to interrupt port operations in southern China in the last month.
In mid-September, Typhoon Chanthu impacted the world’s busiest container port, Shanghai, as well as the Ningbo port complex. Although the storm did not make a direct impact on Shanghai, the port along with others in the region and the airports were all closed. This caused upheaval in the subsequent supply chain as delays in arrivals meant postponing off-loading, cost differentials for freight transport, warehouse storage and store deliveries along with more.
Reflecting back in time on such sites to comprehend if there are related atmospheric triggers or, is there a seasonality to it can help container ships make decisions in advance to ensure cargo, passenger and ship safety. Analysing historical weather data along a route of waypoints, i.e., high risk trajectories, will pave the way for fuel optimisation as well as reducing carbon emissions.
If you’d like to learn more about how historical weather data can help you create smarter voyages and a better world, watch our webinar now to learn directly from the experts.
Paints the truth
Unfortunately, like the rest of the world, the shipping industry is prone to conflict. Maritime insurance service providers can use historical weather data to understand if extreme weather related events impacted a ship disaster or what truly led to it. They can also use it to define their products by assigning premiums on high-risk regions where hurricanes occur or wave heights can thrash cargo and send it into the deepest depths of the sea.

Trains AI and weather models
As a spin-off from Maersk Tankers and a leader in its industry, ZeroNorth is paving the way to provide real-time weather voyage optimisation and aims to deliver a reliable, transparent solution straight to your fingertips. Spire’s maritime historical weather data contributes to the benefit customers can gain from ZeroNorth’s routed voyages helping them get from A to B more optimally.
Companies such as ZeroNorth are tapping into the power of historical weather data to train their fuel optimisation and voyage routing softwares to deliver more accurate results and help the maritime industry to become more sustainable through diminished carbon emissions.
“It’s important to find partners that understand the essence of historical weather data to be in a structured format that’s been cleaned and is easy to use.”
Soren Christian Meyer
Chief Executive Officer, ZeroNorth
Share on Facebook Share on Twitter Share on LinkedIn
It’s simple: the more data points you collect, the more equipped you are to understand the forthcoming potential impact of weather on your business.
However, with meshing infinite, eclectic sources of data into weather models and algorithms can be an exhausting, time-consuming exercise. Why, you may ask? Data gathered across the entire planet may be inconsistent in quality and be delivered in differing layouts.
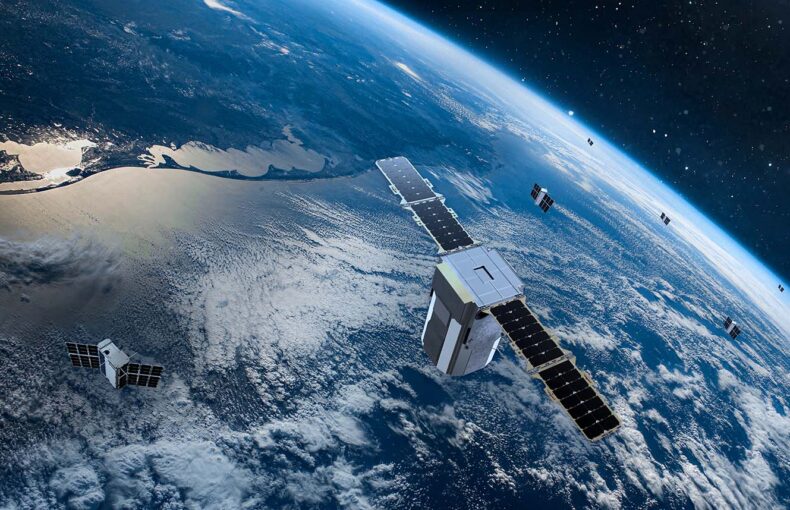
To allow you to focus your energy on your business, Spire steps in to provide unique, rich historical weather datasets that have been through the process of data assimilation and run through machine learning algorithms to increase accuracy. The accuracy of our data is enhanced as we collect data from across all corners of the Earth and reduce the gap of low quality in weather data as we have eyes right in the heavens. With one of the world’s largest nanosatellite constellations in orbit, we’re able to collect observations from the most under-observed regions- including the open oceans.