Spire Global Announces First Quarter 2022 Results
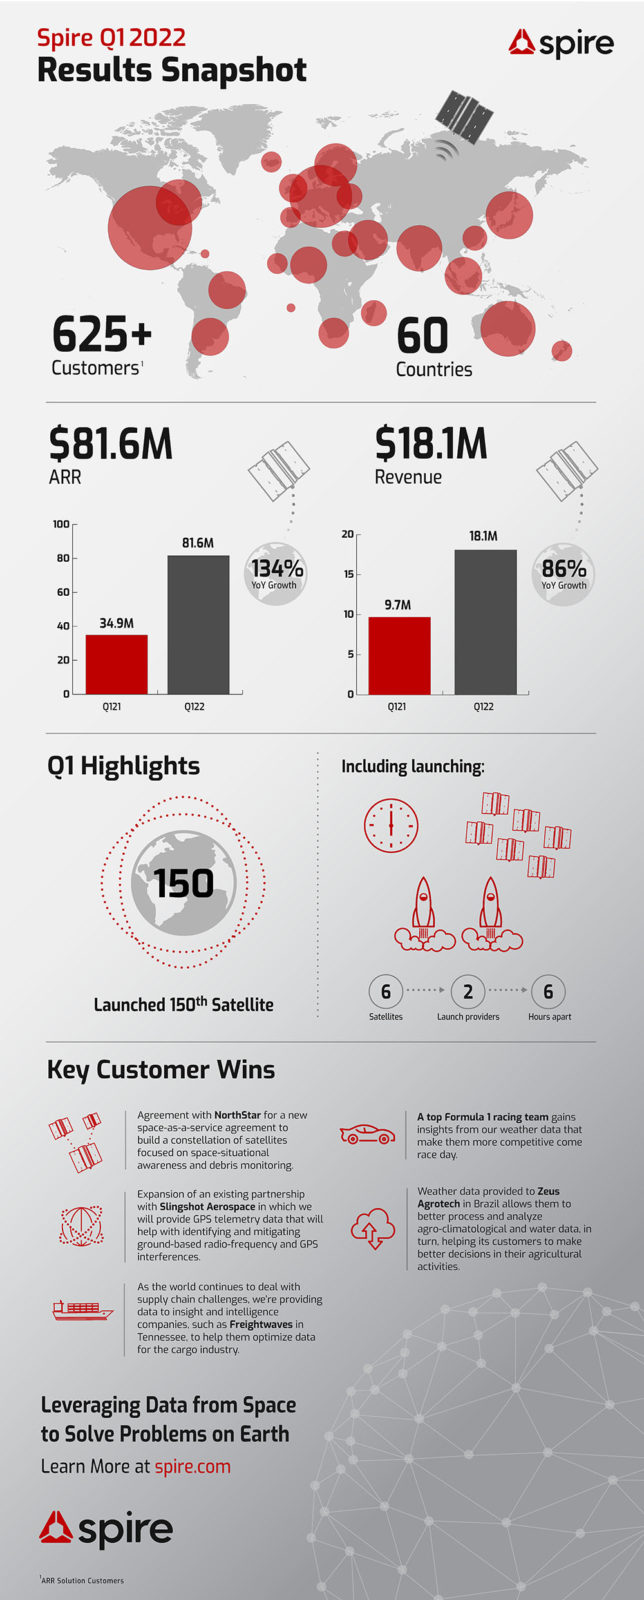
- Revenue increased to $18.1 million resulting in 86% year over year (YoY) growth
- ARR of $81.6 million reflected $10.9 million of sequential and 134% YoY growth
- Improved full year guidance – increased ARR low end range; lowered operating loss1
- Reaffirmed remaining guidance
 VIENNA, Va.–(BUSINESS WIRE)–Spire Global, Inc. (NYSE: SPIR) (“Spire” or “the Company”) a leading provider of space-based data, analytics and space services, today announced results for its quarter ended March 31, 2022. The company will webcast a management call at 5:00 pm ET today to discuss the results.
“The first quarter was defined by strong execution, delivering results that exceeded our expectations on the top and bottom line. As market volatility, inflationary pressures, and supply chain constraints continue to make headlines, Spire is bringing insights to help our customers drive stability and operational efficiencies during these dynamic times,” said Peter Platzer, Spire’s CEO. “Customers recognize the value of Spire data, and we have seen them expand across our data products and up the data value chain. We look for continued growth and further customer diversity as more use cases for Spire’s data become apparent.”
“The first quarter was another outstanding quarter of execution that carried forward our momentum from the end of last year,” said Thomas Krywe, Spire’s CFO. “We are pleased with the Q1 execution across all areas of the business along with the strong growth trajectory. We are well positioned to deliver on our 2022 targets and continue our pursuit of profitability.”
First Quarter 2022 Highlights
Financial:
- First quarter 2022 revenue increased 86% year over year to $18.1 million, which topped the high end of our guidance of $17.5 million, and was driven by increased adoption by existing customers and recent new customer additions.
- As of March 31, 2022, ARR was $81.6 million, up 134% year over year, which exceeded the high end of our guidance. Key wins in Weather and Space Services drove the $10.9 million of sequential quarter over quarter growth.
- As of March 31, 2022, Spire had 627 ARR solution customers under contract, a net increase of 29 customers from December 31, 2021, and ended the quarter on the upper end of our Q1 guidance range.
- First quarter GAAP operating loss was $20.0 million and Non-GAAP operating loss1 was better than guidance by $2.0 million at $12.8 million. Outperformance in the quarter was the result of strong revenue flowing through to margin and lower headcount-related spending. As Spire continues to make investments in future growth, the focus remains on driving efficiencies in the business to reach profitability.
Business:
- In the first quarter, Spire announced a space-as-a-service deal with NorthStar to build a constellation of satellites focused on space-situational awareness and debris monitoring. The first award within the contract is for three satellites, with pre-agreed options for NorthStar to scale the constellation to dozens of satellites as their business operational needs grow.
- During the quarter, Spire also announced the expansion of an existing partnership with Slingshot Aerospace in which it will provide GPS telemetry data that will help with identifying and mitigating ground-based radio-frequency and GPS interferences.
- New, diverse customers such as Freightwaves in Tennessee, Zeus Agrotech in Brazil, and a top Formula 1 racing team looked to Spire’s space-based data for insights and to enhance their businesses.
Technology:
- During the quarter, Spire successfully launched six satellites with two different launch providers within a six hour window. The January launch included our 150th satellite, which boasts 100X the processing power of our first generation spacecraft, a reflection of Spire’s rapid innovation capabilities. The launch also added additional on-orbit space services capability and provided customers with data from the ultimate vantage point of space.
Financial Outlook
Spire is providing guidance for the second quarter ending June 30, 2022, and the full year ending December 31, 2022, as follows:
Q2 FY22 | Full Year FY22 | ||
Guidance | Guidance | ||
| Revenue (millions) | $18.2 – $19.2 | $85.0 – $90.0 | |
| Y/Y Growth | 100% – 111% | 96% – 107% | |
| ARR (millions) | $88.0 – $89.0 | $101.0 – $105.0 | |
| Y/Y Growth | 141% – 143% | 43% – 48% | |
| ARR Solution Customers | 655 – 665 | 720 – 740 | |
| Non-GAAP Operating Loss (millions) | ($13.0) – ($12.0) | ($47.5) – ($42.5) | |
| Adjusted EBITDA (millions) | ($9.9) – ($8.9) | ($34.0) – ($29.0) | |
| Non-GAAP Loss Per Share | ($0.12) – ($0.11) | ($0.43) – ($0.39) | |
| Basic Weighted Average Shares (millions) | 139.8 | 140.0 |
The non-U.S. generally accepted accounting principles (“GAAP”) operating loss, adjusted EBITDA and non-GAAP loss per share included in the table above are non-GAAP measures. Please see the section titled Non-GAAP Financial Measures for the definition of such measures. Spire has provided a reconciliation of GAAP to non-GAAP financial measures in the financial statement tables included in this press release for its first quarter 2021 and 2022 results, as well as its outlook for such measures for second quarter and full year 2022.
Non-GAAP Financial Measures
In addition to financial measures prepared in accordance with GAAP, this press release and the accompanying tables contain, and the conference call will contain, non-GAAP financial measures, including non-GAAP gross profit, non-GAAP operating loss, EBITDA, Adjusted EBITDA and non-GAAP loss per share. Spire’s management uses these non-GAAP financial measures internally in analyzing its financial results and believes they are useful to investors, as a supplement to the corresponding GAAP financial measures, in evaluating its ongoing operational performance and trends and in comparing its financial measures with other companies in the same industry, many of which present similar non-GAAP financial measures to help investors understand the operational performance of their businesses. However, it is important to note that the particular items Spire excludes from, or includes in, its non-GAAP financial measures may differ from the items excluded from, or included in, similar non-GAAP financial measures used by other companies in the same industry. In addition, other companies may utilize metrics that are not similar to Spire’s. The non-GAAP financial information is presented for supplemental informational purposes only and is not intended to be considered in isolation or as a substitute for, or superior to, financial information prepared and presented in accordance with GAAP. There are material limitations associated with the use of non-GAAP financial measures since they exclude significant expenses and income that are required by GAAP to be recorded in Spire’s financial statements. Please see the reconciliation tables at the end of this release for the reconciliation of GAAP and non-GAAP results. Management encourages investors and others to review Spire’s financial information in its entirety and not rely on a single financial measure.
Spire adjusts the following items from one or more of its non-GAAP financial measures:
Loss on satellite deorbit and launch failure. Spire excludes loss on satellite deorbit and launch failure because if there was no loss, the expense would be accounted for as depreciation and would also be excluded as part of its EBITDA calculation.
Change in fair value of warrant liabilities and contingent earned liabilities. Spire excludes this as it does not reflect the underlying cash flows or operational results of the business.
Other expense, net. Spire excludes other expense, net because it includes one-time and other items that do not reflect the underlying operational results of the business.
Stock-based compensation. Spire excludes stock-based compensation expenses primarily because they are non-cash expenses that it excludes from its internal management reporting processes. Spire also finds it useful to exclude these expenses when management assesses the appropriate level of various operating expenses and resource allocations when budgeting, planning, and forecasting future periods. Moreover, because of varying available valuation methodologies, subjective assumptions and the variety of award types that companies can use under FASB ASC Topic 718, Stock Compensation, Spire believes excluding stock-based compensation expenses allows investors to make meaningful comparisons between its recurring core business operating results and those of other companies.
Amortization of purchased intangibles. Spire incurs amortization expense for purchased intangible assets in connection with acquisitions of certain businesses and technologies. Amortization of intangible assets is a non-cash expense and is inconsistent in amount and frequency because it is significantly affected by the timing, size of acquisitions and the inherent subjective nature of purchase price allocations. Because these costs have already been incurred and cannot be recovered, and are non-cash expenses, Spire excludes these expenses for its internal management reporting processes. Spire’s management also finds it useful to exclude these charges when assessing the appropriate level of various operating expenses and resource allocations when budgeting, planning and forecasting future periods. Investors should note that the use of intangible assets contributed to Spire’s revenues earned during the periods presented and will contribute to Spire’s future period revenues as well.
Other Acquisition Accounting Amortization. Spire incurs amortization expense for purchased data rights in connection with the acquisition of exactEarth and certain technologies. Amortization of this asset is a non-cash expense that can be significantly affected by the inherent subjective nature of the assigned value and useful life. Because this cost has already been incurred and cannot be recovered, and is a non-cash expense, Spire excludes this expense for its internal management reporting processes. Spire’s management also finds it useful to exclude this charge when assessing the appropriate level of various operating expenses and resource allocations when budgeting, planning and forecasting future periods. Investors should note that the use of this asset contributed to Spire’s revenues earned during the periods presented and will contribute to Spire’s future period revenues as well.
Mergers and acquisition related expenses. We exclude these expenses as they are transaction costs and expenses associated with the transaction that are generally one time in nature and not reflective of the underlying operational results of our business. Examples of these types of expenses include legal, accounting, regulatory, other consulting services, severance, and other employee costs.
Other unusual one-time costs. Spire excludes these as these are generally non-recurring items that do not reflect the on-going operational results of its business.
Our additional non-GAAP measures include:
EBITDA. We define EBITDA as net income (loss), plus depreciation and amortization expense, plus interest expense, and plus the provision for (or minus benefit from) income taxes.
Adjusted EBITDA. We define Adjusted EBITDA as earnings before interest, taxes, depreciation and amortization, further adjusted for loss on satellite deorbit and launch failure, change in fair value of warrant liabilities, change in value of contingent earned liability, other (expense) income, net, stock-based compensation, other acquisition accounting amortization, mergers and acquisition related costs and expenses, and other unusual one-time costs. We believe Adjusted EBITDA can be useful in providing an understanding of the underlying operating results and trends and an enhanced overall understanding of our financial performance and prospects for the future. While Adjusted EBITDA is not a recognized measure under GAAP, management uses this financial measure to evaluate and forecast business performance. Adjusted EBITDA is not intended to be a measure of liquidity or cash flows from operations or a measure comparable to net income as it does not take into account certain requirements, such as capital expenditures and related depreciation, principal and interest payments, and tax payments. Adjusted EBITDA is not a presentation made in accordance with GAAP, and our use of the term Adjusted EBITDA may vary from the use of similarly titled measures by others in our industry due to the potential inconsistencies in the method of calculation and differences due to items subject to interpretation.
Other Definitions
Annual Recurring Revenue (ARR). We define ARR as our expected annualized revenue from customers that are under contract with us at the end of the reporting period with a binding and renewable agreement for our subscription solutions, or a customer that has a binding multi-year contract that can range from components of our Space Services solution to a project based customer solution. These customers are considered recurring when they have signed a multi-year binding agreement that has a renewable component in the contract or a customer that has multiple contracts that we continue to have under contract over multiple years.
ARR Customers. We define an ARR Customer as an entity that has a contract with us or through our reseller partners contracts, that is either a binding and renewable agreement for our subscription solutions, or a binding multi-year contract as of the measurement date independent of the number of solutions the entity has under contract. All entities that have customer contracts for data trials are excluded from the calculation of ARR Customers. A single organization with separate subsidiaries, segments, or divisions may represent multiple customers, as we treat each entity that is invoiced separately as an individual customer. In cases where customers subscribe to our platform through our reseller partners, each end customer that meets the above definition is counted separately as an ARR Customer.
ARR Solution Customers. We define an ARR Solution Customer similarly to an ARR Customer, but we count every solution the customer has with us separately. As a result, the count of ARR Solution Customers exceeds the count of ARR Customers in each year as some customers contract with us for multiple solutions. Our multiple solutions customers are those customers that are under contract for at least two of our solutions: Maritime, Aviation, Weather, and Space Services.
Conference Call
Spire will webcast a conference call to discuss the results at 5:00 p.m. Eastern Time today. The webcast is available on Spire’s Investor Relations website at https://ir.spire.com/. A replay of the call will be available on the site for three months.
Safe Harbor Statement
The forward-looking statements included in this press release and in the accompanying conference call, including for example, the quotations of management, the statements under the heading “Financial Outlook” above, the information provided in the “GAAP to Non-GAAP Reconciliations – Q2 2022 and Fiscal Year 2022 Financial Outlook” section of the tables below, statements about the integration of exactEarth and the growth opportunities of the combined company, statements regarding continued growth, statements regarding Spire’s expected timing to generate positive cash flow, statements regarding increasing its ARR, and statements regarding the benefits of its solutions to its customers, reflect management’s best judgment based on factors currently known and involve risks and uncertainties. These risks and uncertainties include, but are not limited to, potential disruption of customer purchase decisions resulting from global economic conditions including from an economic downturn or recession in the United States or in other countries around the world, relative growth of its ARR and revenue, the failure of the Spire and exactEarth businesses (including personnel) to be integrated successfully, the risk that revenue and adjusted EBITDA accretion or the expansion of Spire’s customer count, ARR, product offerings and solutions will not be realized or realized to the extent anticipated, the ability to maintain the listing of Spire’s securities on the New York Stock Exchange, the ability to address the market opportunity for Space-as-a-Service; the ability to implement business plans, forecasts, and other expectations, and identify and realize additional opportunities, the risk of downturns, new entrants and a changing regulatory landscape in the highly competitive space data analytics industries, developments in and the duration of the COVID-19 pandemic and the resulting impact on Spire’s business and operations, and the business of its customers and partners, including the economic impact of safety measures to mitigate the impacts of COVID-19, Spire’s potential inability to manage effectively any growth it experiences, Spire’s ability or inability to develop new products and services, and other risks detailed in periodic reports Spire has filed with the Securities and Exchange Commission, including Spire’s Annual Report on Form 10-K, which was filed with the SEC on March 30, 2022. Significant variation from the assumptions underlying Spire’s forward-looking statements could cause its actual results to vary, and the impact could be significant. All forward-looking statements in this press release are based on information available to Spire as of the date hereof. Spire undertakes no obligation, and does not intend, to update the information contained in this press release or the accompanying conference call, except as required by law.
About Spire Global, Inc.
Spire is a leading global provider of space-based data, analytics, and space services, offering access to unique datasets and powerful insights about Earth from the ultimate vantage point so that organizations can make decisions with confidence, accuracy, and speed. Spire uses one of the world’s largest multi-purpose satellite constellations to source hard to acquire, valuable data and enriches it with predictive solutions. Spire then provides this data as a subscription to organizations around the world so they can improve business operations, decrease their environmental footprint, deploy resources for growth and competitive advantage, and mitigate risk. Spire gives commercial and government organizations the competitive advantage they seek to innovate and solve some of the world’s toughest problems with insights from space. Spire has offices in San Francisco, Boulder, Washington DC, Glasgow, Luxembourg, Oxfordshire, Cambridge, Ontario, and Singapore. To learn more, visit spire.com.
1 Non-GAAP Financial Measure, please see section titled Non-GAAP Financial Measures for the definition of such measures
CONSOLIDATED STATEMENTS OF OPERATIONS | ||||||||
Three Months Ended March 31, | ||||||||
| (In thousands, except share and per share amounts) | 2022 | 2021 | ||||||
(Unaudited) | (Unaudited) | |||||||
| Revenue | $ | 18,070 | $ | 9,716 | ||||
| Cost of revenue | 9,846 | 3,328 | ||||||
| Gross profit | 8,224 | 6,388 | ||||||
| Operating expenses | ||||||||
| Research and development | 8,657 | 6,900 | ||||||
| Sales and marketing | 6,905 | 3,941 | ||||||
| General and administrative | 12,684 | 8,394 | ||||||
| Total operating expenses | 28,246 | 19,235 | ||||||
| Loss from operations | (20,022 | ) | (12,847 | ) | ||||
| Other income (expense) | ||||||||
| Interest income | 14 | 1 | ||||||
| Interest expense | (3,043 | ) | (2,550 | ) | ||||
| Change in fair value of contingent earnout liability | 517 | – | ||||||
| Change in fair value of warrant liabilities | 5,835 | (5,991 | ) | |||||
| Other (expense) income, net | (1,169 | ) | 2,076 | |||||
| Total other income (expense), net | 2,154 | (6,464 | ) | |||||
| Loss before income taxes | (17,868 | ) | (19,311 | ) | ||||
| Income tax provision | 290 | 387 | ||||||
| Net loss | $ | (18,158 | ) | $ | (19,698 | ) | ||
| Basic and diluted net loss per share | $ | (0.13 | ) | $ | (1.11 | ) | ||
| Weighted-average shares used in computing basic and diluted net loss per share | 139,274,538 | 17,750,210 | ||||||
Three Months Ended March 31, | ||||||||
2022 | 2021 | |||||||
| Net loss | $ | (18,158 | ) | $ | (19,698 | ) | ||
| Other comprehensive loss: | ||||||||
| Foreign currency translation adjustments | 1,859 | 32 | ||||||
| Comprehensive loss | $ | (16,299 | ) | $ | (19,666 | ) | ||
CONSOLIDATED BALANCE SHEETS | |||||||
| March 31, | December 31, | ||||||
2022 | 2021 | ||||||
| (In thousands) | (Unaudited) | (Audited) | |||||
| Assets | |||||||
| Current assets | |||||||
| Cash and cash equivalents | $ | 91,592 | $ | 109,256 | |||
| Accounts receivable, net (including allowance of $301 and $339 as of March 31, 2022 and December 31, 2021, respectively) | 7,821 | 10,163 | |||||
| Contract assets | 3,630 | 2,084 | |||||
| Other current assets | 8,451 | 10,071 | |||||
| Total current assets | 111,494 | 131,574 | |||||
| Property and equipment, net | 52,071 | 48,704 | |||||
| Operating lease assets | 11,003 | – | |||||
| Goodwill | 54,245 | 53,627 | |||||
| Customer relationships | 24,091 | 24,388 | |||||
| Intangible assets, net | 18,707 | 19,765 | |||||
| Other long-term assets, including restricted cash | 11,767 | 12,136 | |||||
| Total assets | $ | 283,378 | $ | 290,194 | |||
| Liabilities and Stockholders’ Equity | |||||||
| Current liabilities | |||||||
| Accounts payable | $ | 7,220 | $ | 5,824 | |||
| Accrued wages and benefits | 4,597 | 5,646 | |||||
| Contract liabilities, current portion | 6,483 | 8,627 | |||||
| Other accrued expenses | 7,742 | 4,881 | |||||
| Total current liabilities | 26,042 | 24,978 | |||||
| Long-term debt | 52,682 | 51,124 | |||||
| Contingent earnout liability | 10,852 | 11,369 | |||||
| Deferred income tax liabilities | 813 | 777 | |||||
| Warrant liability | 5,647 | 11,482 | |||||
| Operating lease liabilities, net of current portion | 10,089 | – | |||||
| Other long-term liabilities | 1,761 | 1,600 | |||||
| Total liabilities | 107,886 | 101,330 | |||||
| Commitments and contingencies | |||||||
| Stockholders’ equity | |||||||
| Common stock | 15 | 15 | |||||
| Additional paid-in capital | 421,502 | 418,575 | |||||
| Accumulated other comprehensive income | 2,591 | 732 | |||||
| Accumulated deficit | (248,616 | ) | (230,458 | ) | |||
| Total stockholders’ equity | 175,492 | 188,864 | |||||
| Total liabilities and stockholders’ equity | $ | 283,378 | $ | 290,194 | |||
CONSOLIDATED STATEMENTS OF CASH FLOWS | |||||||
| Three Months Ended March 31, | |||||||
2022 | 2021 | ||||||
| (In thousands) | (Unaudited) | (Unaudited) | |||||
| Cash flows from operating activities | |||||||
| Net loss | $ | (18,158 | ) | $ | (19,698 | ) | |
| Adjustments to reconcile net loss to net cash used in operating activities: | |||||||
| Depreciation and amortization | 4,834 | 1,711 | |||||
| Stock-based compensation | 2,289 | 2,507 | |||||
| Amortization of operating lease assets | 573 | – | |||||
| Accretion on carrying value of convertible notes | – | 1,407 | |||||
| Amortization of debt issuance costs | 1,413 | 616 | |||||
| Change in fair value of warrant liability | (5,835 | ) | 5,991 | ||||
| Change in fair value of contingent earnout liability | (517 | ) | – | ||||
| Loss on extinguishment of debt | – | (1,699 | ) | ||||
| Changes in operating assets and liabilities: | |||||||
| Accounts receivable, net | 2,215 | (3,799 | ) | ||||
| Contract assets | (1,531 | ) | 38 | ||||
| Other current assets | 1,409 | 40 | |||||
| Other long-term assets | 469 | – | |||||
| Accounts payable | (828 | ) | 1,080 | ||||
| Accrued wages and benefits | (1,051 | ) | (420 | ) | |||
| Contract liabilities | (962 | ) | (244 | ) | |||
| Other accrued expenses | 1,077 | 1,655 | |||||
| Operating lease liabilities | (342 | ) | – | ||||
| Other long-term liabilities | (46 | ) | (6 | ) | |||
| Net cash used in operating activities | (14,991 | ) | (10,821 | ) | |||
| Cash flows from investing activities | |||||||
| Purchase of property and equipment | (4,243 | ) | (1,378 | ) | |||
| Investment in intangible assets | (19 | ) | – | ||||
| Net cash used in investing activities | (4,262 | ) | (1,378 | ) | |||
| Cash flows from financing activities | |||||||
| Proceeds from long-term debt | 95 | – | |||||
| Proceeds from issuance of convertible notes payable | – | 20,000 | |||||
| Payments of debt issuance costs | – | (62 | ) | ||||
| Proceeds from exercise of stock options | 638 | 295 | |||||
| Net cash provided by financing activities | 733 | 20,233 | |||||
| Effect of foreign currency translation on cash, cash equivalent and restricted cash | 850 | (590 | ) | ||||
| Net (decrease) increase in cash, cash equivalents and restricted cash | (17,670 | ) | 7,444 | ||||
| Cash, cash equivalents and restricted cash | |||||||
| Beginning of year | 109,645 | 15,986 | |||||
| End of year | $ | 91,975 | $ | 23,430 | |||
GAAP to Non-GAAP Reconciliations | ||||||||
| Three Months Ended March 31, | ||||||||
| (In thousands, except for share and per share amounts) | 2022 | 2021 | ||||||
| Gross profit (GAAP) | $ | 8,224 | $ | 6,388 | ||||
| Adjustments: | ||||||||
| Exclude stock-based compensation | 77 | 18 | ||||||
| Exclude amortization of purchased intangibles | 919 | – | ||||||
| Exclude other acquisition accounting amortization | 183 | – | ||||||
| Exclude merger and acquisition related expenses | 77 | – | ||||||
| Gross profit (Non-GAAP) | $ | 9,480 | $ | 6,406 | ||||
| Research and development (GAAP) | 8,657 | 6,900 | ||||||
| Adjustments: | ||||||||
| Exclude stock-based compensation | (711 | ) | (585 | ) | ||||
| Exclude merger and acquisition related expenses | (168 | ) | – | |||||
| Research and development (Non-GAAP) | 7,778 | 6,315 | ||||||
| Sales and marketing (GAAP) | 6,905 | 3,941 | ||||||
| Adjustments: | ||||||||
| Exclude stock-based compensation | (616 | ) | (316 | ) | ||||
| Exclude amortization of purchased intangibles | (815 | ) | – | |||||
| Exclude merger and acquisition related expenses | (168 | ) | – | |||||
| Sales and marketing (Non-GAAP) | 5,306 | 3,625 | ||||||
| General and administrative (GAAP) | 12,684 | 8,394 | ||||||
| Adjustments: | ||||||||
| Exclude stock-based compensation | (885 | ) | (1,588 | ) | ||||
| Exclude merger and acquisition related expenses | (2,601 | ) | (2,267 | ) | ||||
| Exclude other unusual one-time costs | – | (387 | ) | |||||
| General and administrative (Non-GAAP) | 9,198 | 4,152 | ||||||
| Loss from operations (GAAP) | $ | (20,022 | ) | $ | (12,847 | ) | ||
| Adjustments: | ||||||||
| Exclude stock-based compensation | 2,289 | 2,507 | ||||||
| Exclude merger and acquisition related expenses | 3,014 | 2,267 | ||||||
| Exclude amortization of purchased intangibles | 1,734 | – | ||||||
| Exclude other acquisition accounting amortization | 183 | – | ||||||
| Exclude other unusual one-time costs | – | 387 | ||||||
| Loss from operations (Non-GAAP) | $ | (12,802 | ) | $ | (7,686 | ) | ||
| Net loss (GAAP) | $ | (18,158 | ) | $ | (19,698 | ) | ||
| Adjustments: | ||||||||
| Exclude stock-based compensation | 2,289 | 2,507 | ||||||
| Exclude merger and acquisition related expenses | 3,014 | 2,267 | ||||||
| Exclude amortization of purchased intangibles | 1,734 | – | ||||||
| Exclude other acquisition accounting amortization | 183 | – | ||||||
| Exclude change in fair value of contingent earnout liability | (517 | ) | – | |||||
| Exclude change in fair value of warrant liabilities | (5,835 | ) | 5,991 | |||||
| Exclude other (expense) income, net | 1,169 | (2,076 | ) | |||||
| Exclude other unusual one-time costs | – | 387 | ||||||
| Net loss (Non-GAAP) | $ | (16,121 | ) | $ | (10,622 | ) | ||
| Net loss per share (GAAP) | $ | (0.13 | ) | $ | (1.11 | ) | ||
| Adjustments: | ||||||||
| Exclude stock-based compensation | 0.02 | 0.14 | ||||||
| Exclude merger and acquisition related expenses and other unusual one-time costs | 0.02 | 0.15 | ||||||
| Exclude amortization of purchased intangibles and other acquisition accounting amortization | 0.01 | – | ||||||
| Exclude change in fair value of warrant liabilities and change in value of contingent earnout liability | (0.05 | ) | 0.34 | |||||
| Exclude other (expense) income, net | 0.01 | (0.12 | ) | |||||
| Net loss per share (Non-GAAP) | $ | (0.12 | ) | $ | (0.60 | ) | ||
| Weighted-average shares used in computing basic and diluted net loss per share | 139,274,538 | 17,750,210 | ||||||
| Net loss (GAAP) | $ | (18,158 | ) | $ | (19,698 | ) | ||
| Depreciation and amortization | 4,834 | 1,711 | ||||||
| Net Interest | 3,029 | 2,549 | ||||||
| Taxes | 290 | 387 | ||||||
| EBITDA | (10,005 | ) | (15,051 | ) | ||||
| Change in fair value of contingent earnout liability | (517 | ) | – | |||||
| Change in fair value of warrant liabilities | (5,835 | ) | 5,991 | |||||
| Other (expense) income, net | 1,169 | (2,076 | ) | |||||
| Stock-based compensation | 2,289 | 2,507 | ||||||
| Mergers and acquisition related expenses | 3,014 | 2,267 | ||||||
| Other unusual one-time costs | – | 387 | ||||||
| Other acquisition accounting amortization | 183 | – | ||||||
| Adjusted EBITDA | $ | (9,702 | ) | $ | (5,975 | ) | ||
GAAP to Non-GAAP Reconciliations – Q2 2022 and Full Year 2022 Financial Outlook | ||||||||
| (In thousands, except for share and per share amounts) | Q2’22 Ranges | |||||||
| Low | High | |||||||
| Revenue | $ | 18,200 | $ | 19,200 | ||||
| Low | High | |||||||
| Loss from operations (GAAP) | $ | (18,032 | ) | $ | (17,032 | ) | ||
| Adjustments: | ||||||||
| Exclude stock-based compensation | 2,404 | 2,404 | ||||||
| Exclude merger and acquisition related expenses | 711 | 711 | ||||||
| Exclude amortization of purchased intangibles | 1,734 | 1,734 | ||||||
| Exclude other acquisition accounting amortization | 183 | 183 | ||||||
| Loss from operations (Non-GAAP) | $ | (13,000 | ) | $ | (12,000 | ) | ||
| Low | High | |||||||
| Net loss per share (GAAP) | $ | (0.16 | ) | $ | (0.15 | ) | ||
| Adjustments: | ||||||||
| Exclude stock-based compensation | 0.02 | 0.02 | ||||||
| Exclude merger and acquisition related expenses | 0.01 | 0.01 | ||||||
| Exclude purch intangibles and other purch acctg amortization | 0.01 | 0.01 | ||||||
| Exclude other expense, net | 0.00 | 0.00 | ||||||
| Net loss per share (Non-GAAP) | $ | (0.12 | ) | $ | (0.11 | ) | ||
| Weighted-average shares used in computing basic and diluted net loss per share | 139,802,512 | 139,802,512 | ||||||
| Low | High | |||||||
| Net loss (GAAP) | $ | (21,742 | ) | $ | (20,742 | ) | ||
| Depreciation and amortization | 4,884 | 4,884 | ||||||
| Net Interest | 3,033 | 3,033 | ||||||
| Taxes | 351 | 351 | ||||||
| EBITDA | $ | (13,474 | ) | $ | (12,474 | ) | ||
| Stock-based compensation | 2,404 | 2,404 | ||||||
| Mergers and acquisition related expenses | 711 | 711 | ||||||
| Other acquisition accounting amortization | 183 | 183 | ||||||
| Other expense, net | 326 | 326 | ||||||
| Adjusted EBITDA | $ | (9,850 | ) | $ | (8,850 | ) | ||
| (In thousands, except for share and per share amounts) | FY 2022 Ranges | |||||||
| Low | High | |||||||
| Revenue | 85,000 | 90,000 | ||||||
| Low | High | |||||||
| Loss from operations (GAAP) | $ | (68,555 | ) | $ | (63,555 | ) | ||
| Adjustments: | ||||||||
| Exclude stock-based compensation | 9,573 | 9,573 | ||||||
| Exclude merger and acquisition related expenses | 4,086 | 4,086 | ||||||
| Exclude amortization of purchased intangibles | 6,665 | 6,665 | ||||||
| Exclude other acquisition accounting amortization | 731 | 731 | ||||||
| Loss from operations (Non-GAAP) | $ | (47,500 | ) | $ | (42,500 | ) | ||
| Low | High | |||||||
| Net loss per share (GAAP) | $ | (0.55 | ) | $ | (0.51 | ) | ||
| Adjustments: | ||||||||
| Exclude stock-based compensation | 0.07 | 0.07 | ||||||
| Exclude merger and acquisition related expenses | 0.03 | 0.03 | ||||||
| Exclude purch intangibles and other acq acctg amortization | 0.05 | 0.05 | ||||||
| Exclude other income, net | (0.03 | ) | (0.03 | ) | ||||
| Net loss per share (Non-GAAP) | $ | (0.43 | ) | $ | (0.39 | ) | ||
| Weighted-average shares used in computing basic and diluted net loss per share | 139,985,249 | 139,985,249 | ||||||
| Low | High | |||||||
| Net loss (GAAP) | $ | (76,993 | ) | $ | (71,993 | ) | ||
| Depreciation and amortization | 20,161 | 20,161 | ||||||
| Net Interest | 12,127 | 12,127 | ||||||
| Taxes | 514 | 514 | ||||||
| EBITDA | $ | (44,191 | ) | $ | (39,191 | ) | ||
| Stock-based compensation | 9,573 | 9,573 | ||||||
| Mergers and acquisition related expenses | 4,086 | 4,086 | ||||||
| Other acquisition accounting amortization | 731 | 731 | ||||||
| Other income, net | (4,204 | ) | (4,204 | ) | ||||
| Adjusted EBITDA | $ | (34,005 | ) | $ | (29,005 | ) | ||
Contacts
Benjamin Hackman
Head of Investor Relations
[email protected]
Hillary Yaffe
Head of Communications
[email protected]