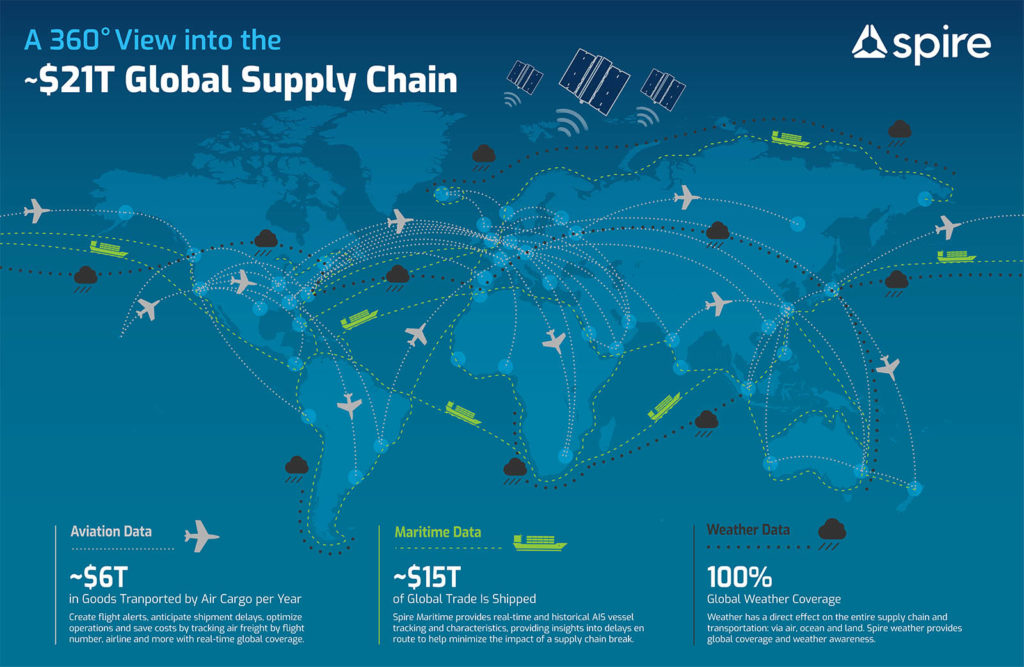
Leveraging the power of satellite data to mitigate the global supply chain crisis
 Written by
Sharmain Zain
Content Manager at Spire Weather
This article is the first in a series covering the worldwide supply chain disruptions and how Spire’s global solutions are helping alleviate these pain points across diverse industries including maritime, aviation and weather.
We live in incredible times where technology places the world at our fingertips. Simple tasks such as going to the grocery store can be avoided as orders can be placed via applications that’ll deliver groceries to your place within a matter of minutes to at most a few hours.
Grappling with the third year of a world-wide pandemic, rising consumer demand, the sudden occupation of Ukraine, and the ramifications of climate change, the global supply chain is under intense stress. This trickles down to influence all facets of global commerce, food supply and merchandise consumption. Satellites, such as the ones Spire Global builds and launches into space, are playing their part in putting the pieces together to bring order to the logistical chaos.

Let’s say that you want to order the latest iPad. In May 2021, Apple issued a statement saying that it would not be able to make enough MacBooks and iPads because of the global semiconductor shortage. Now, you might be wondering how this impacts Apple’s production.
It’s simple: goods move around the world through a highly complex, highly interlinked process known as the global supply chain, which consists of multiple stakeholders. As 90% of modern global trade is still carried out on the seas, one delayed shipment generates a domino effect that reverberates throughout the subsequent channels in the supply sphere. Interestingly, given the constraints faced by the maritime transport sector, demand for air cargo grew to cater to speedy, urgent deliveries.
The International Air Transport Association reports that demand in cargo tonne km terms (CTK) increased by 9.1% in September 2021 compared with the same month in 2019.
No matter what the mode of transport is, it’s the “last mile” that determines the final leg of the journey of the goods in question. It’s imperative that the last mile be flexible as it influences customer experience and satisfaction.
Trade is one of the oldest professions in the world and can be traced back to ancient civilizations such as the Greeks, the Romans and the Indus. From the time when the Silk Route connected the East to the West – where spices, perfumes, silk cloth and much more were exchanged – to the present day, trade blurs national boundaries and connects people with similar interests. However, while we live in a period where access to convenience and luxury is abundant, we also have to understand the challenges that come with it.
What are the threats to supply chain security?
The COVID-19 pandemic and its adverse impact on international economies, businesses, and communities has tested the resiliency of mankind. Sprinkle in climate change and several geopolitical events and it is clear just how imperative it is for organizations to strategically plan their operations in a manner that can effectively anticipate disruptions and make necessary adjustments to keep the supply chain engine running smoothly.
1. Sociopolitical forces
International relations influence foreign, trade, and economic policies. Consider an on-going example: the current war in Ukraine. Since Russia invaded Ukraine, there has been a direct negative effect on the global food network. Ukraine is the number three exporter of wheat and number four for grain. On February 24, 2022 Ukraine’s military suspended commercial shipping at its ports to protect the local food supply, which caused prices to rise globally. Grain is one of the most essential yet underrated commodities in the world. It’s critical to ensure that grain shipment deadlines are met, but the impact of port slowdowns on global supply chains extends even further. Vessel charter agreements specify an allotted time for loading and unloading and if rain isn’t taken into account during negotiations, then it can quickly affect the charterer’s bottom line. Even vessels carrying other commodities that are stuck at anchorage while berthed cargo ships wait to discharge or load grain can mean the difference between a successful voyage and a delayed one.
It’s not just grain exports that are impacted by this particular crisis. The international community has slammed sanctions on Russia and this has exposed vulnerabilities in the global supply of oil. It’s important to note that Russia is the largest oil exporter in the world. The International Energy Agency warned that over 3 million barrels of oil per day could be cut off from global oil markets, resulting in one of the biggest supply shortfalls since the 1970s. Spire’s AIS data reflected a declining number of Russian vessels moving through the Bosphorus strait (the only warm water exit point to the Mediterranean Sea from Russia) in March 2022 as a result.
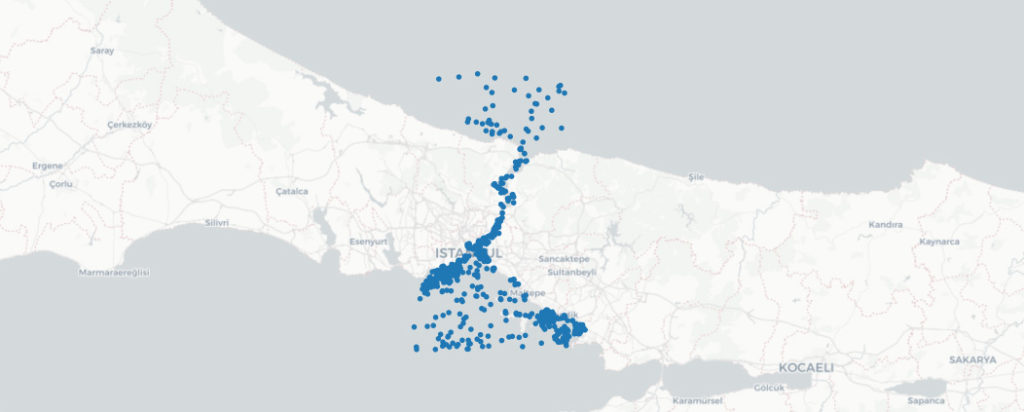
Sample vessel positions by the Bosphorus
Then there’s the USA-China trade tensions to consider. In 2018-19, America increased Chinese import tariffs, primarily on metals and machinery. China counter-acted by not only adding tariffs on American goods but also lowering tariffs on imports from other nations. These moves were in stark contrast to the tariff liberalization taking place at the time across the globe. Interestingly, China’s exports to America fell by 8.5% but rose to the rest of the world by 5.5%. US exports to the Chinese economy fell by 26.3% but only increased by a modest 2.2% to other countries. With import and export flows being increased and reallocated, world trade rose by 3%.
2. Pandemic
Even as the world slowly trickles back to a semblance of pre-pandemic life, we still experience the impact of a stressed international trade network. Ships continue to remain on standby for berth space off the coast of Los Angeles. It was recently reported that approximately 101 ships are anchored 150 miles away from the shoreline as per the new regulations enforced by the busy Southern California port. A similar pattern resonates half-way across the world at the Port of Shanghai, one of the busiest hubs in the trading sphere. Due to a strict lockdown, about 300 sea-faring vessels are waiting to load or discharge. It also shut down in September 2021 due to Typhoon Chanthu – a by-product of the warming climate. Recently, a rise in COVID cases also had China place Shenzhen, its local tech hub, under lockdown. Home to the world’s third largest port that receives a majority of China’s electronic goods, Spire’s AIS data reflected a sharp fall in vessel traffic within the Yantian port due to the lockdown.
Daily count of unique vessels detected
Even when COVID-19 sent the world into its first lockdown back in early 2020 and grounded airline fleets, there became a dearth of weather data. Our satellites continued to encircle in space and perform their job, providing crucial weather data.
You’ll very well remember how in early 2020 the pandemic grounded airplanes all over the world. While air passenger traffic has suffered losses worth $200 billion up to March 2022, freight forwarders and air cargo subsectors enjoyed an upsurge in revenue. Air cargo carriers earned a 9% profit while freight forwarders gained 4%. This can be attributed to the expedited need for personal protective equipment, masks, and medicine.
3. Climate change and weather impact on the entire supply chain (air, sea, land)
It’s not just ports that can cause delays in subsequent stages of the supply network. Near the end of 2020, the Apus One embarked on its journey from China to Long Beach, California and lost almost 2,000 containers due to gale force winds and massive ocean swells. This took place 1,600 nautical miles northwest of Hawaii and incurred losses of approximately $200 million. In 2020 alone, approximately 3,000 containers fell overboard. Whilst shipping companies and their crews do their best to secure their cargo, poor weather conditions and waves may flood vessels causing damage to cargo items or even submerging them into watery depths.
In spring 2021, the world watched as the mighty 200,000 metric-ton vessel Evergreen was run aground due to strong gusts of wind and blocked the strategic Suez Canal waterway for almost a week. The grounded vessel was blocking trade worth $9.6 billion a day. Spire forecasted these weather conditions the day before the collision. Spire’s weather forecast issued at 00:00 UTC on March 22nd predicted wind gusts at speeds of 13 meters per second (30 miles per hour) and above. Knowing about these kinds of hazardous conditions by having access to accurate, reliable weather forecasts in advance could potentially mitigate such costly delays.
This WMS visualization illustrates 48 hours of wind activity in the Suez Canal region, from March 22nd (00:00 UTC) until March 24th (00:00 UTC). The speeds are measured in meters per second.
Let’s anchor sea-faring trade stories for a moment and venture on-shore.
Last November, the Canadian province of British Columbia experienced major rainfall that caused mudslides and floods and blocked strategic road routes that linked to the nation’s largest port. Canadian exports constitute one-third of the country’s GDP and journey through the Pacific Ocean to reach Asian markets. However, due to Canada’s topography, only two rail lines and a few highways have been carved through the Rocky Mountains and jagged British Columbian land to get to the Port of Vancouver. Hence, such disturbances choke up the entire supply chain. Earlier in the summer, the local town of Lytton was destroyed by wildfires that spread to the railways, disrupting the export of lumber distribution to key markets. This pushed up international prices as there was a dearth in supply and negatively impacted the American economy as it depends on over a quarter of its lumber demand to be fulfilled by its northern neighbor.
Scientists predict that the repercussions on the international supply chain caused by climate change will only amplify in the coming years. The entire supply chain infrastructure will be subject to threat from extreme weather events due to sea levels rising by two to six feet.
Hurricane Ida, one of the most intense storms to ever hit the USA, wreaked havoc across Louisiana in August 2021, leaving many without power for the next 30 days or more. It took 50 lives and cost $65 billion in damages. The question that arises is: to what extent could we have minimized these consequences if we’d known that such a powerful natural disaster is coming? Take a look at Spire’s weather data to track activity around offshore supply vessels and see how they prepared and reacted to storm warnings in the region.
The visualization above compares the tracking of strong low pressure systems in the Spire Weather and two other popular weather forecast models, compared with the actual hurricane track data from the National Hurricane Center (NHC) to show the accuracy of the three models (using 6 day forecasts from all 3 models).
Below is the Spire Weather’s track and model-derived reflectivity of the hurricane.
When you club Hurricane Ida, Texas ice, British Columbia floods, American tornadoes, Australian wildfires, and typhoons at Chinese ports together – you’ll understand the magnitude of the challenge that supply chain managers are facing today.
Why does a small disruption in the supply network echo globally?
Download this white paper to understand the power of satellite technology in minimizing supply chain disruptions.