Historical weather data optimizes container shipping operations
Interested in this FREE data set?
In this Spire data story, we will illustrate the myriad of ways historical weather data can improve business transparency, determine more accurate delivery dates, and contribute to a more optimal fuel economy. As global supply chains continue to struggle to keep up with global demand, data is a useful tool for optimizing your business contingency plans in such unprecedented times.
The greatest challenge facing ship owners and operators today is how to achieve a balance between on-time delivery, safety and fuel consumption. Running a ship, much less a fleet, is an expensive business- of which fuel forms one of the largest costs. For operators of vessels that run on fixed schedules, such as container shipping, this is no easy feat to achieve.
The promise a container shipping line makes and sells to clients is that of on-time delivery. Global supply chains depend highly on vessels to arrive at their respective destinations at the stated time and dates. The concept of “Just-in-Time” has created the benefit of reducing the need for B2C companies to maintain large stockpiles of inventory, at the risk of stock shortages if there is any delay in the supply chain.
Unsafe routes can lead to multi-million dollar losses
Consider ships that sail from Asia to the US West Coast and cross the North Pacific Ocean – they’re inundated with a set of challenges that can be encountered by tapping into the hidden value of historical weather data. Many fleets take on voyages that benefit from the Kuroshio Current that runs up the southern coast of Japan. It allows these ships to burn less fuel, reduce their carbon footprint and still arrive on time in Los Angeles due to the direction of the current flow.
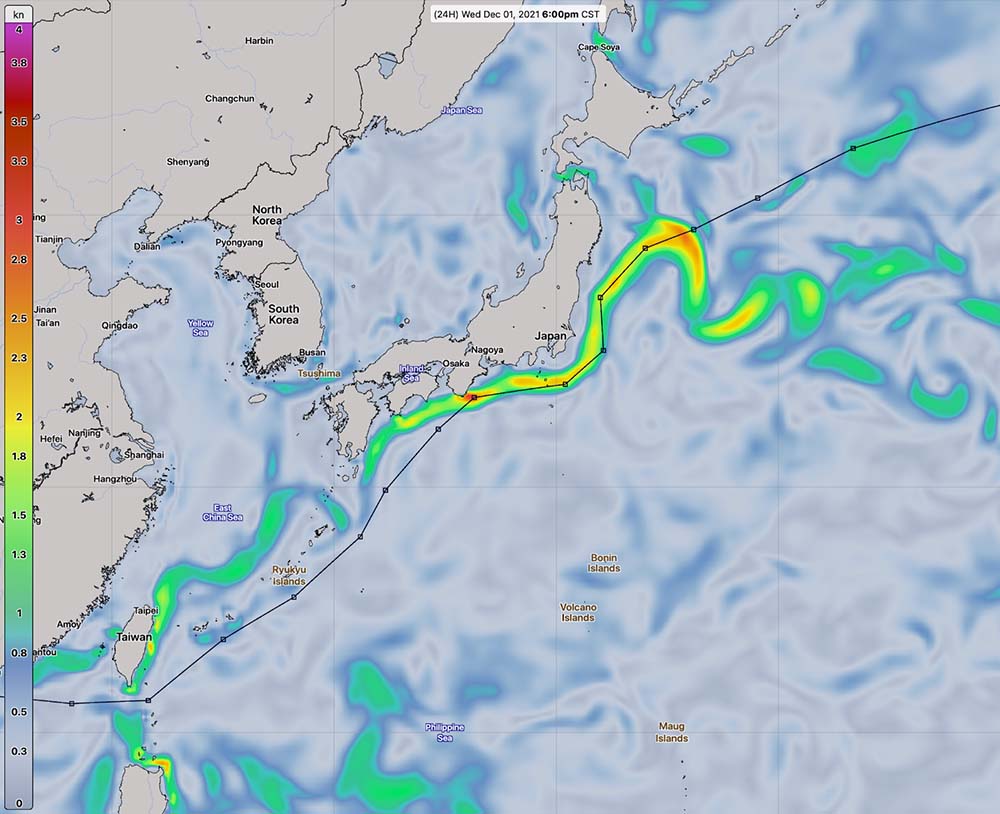
The image above shows Spire Global Inc.’s data plotting the Kuroshio Current off the coast of Japan. This visual shows an overlay of ships utilizing the Kuroshio Current off the coast of Japan.
On the contrary, the North Pacific Ocean can be a particularly unforgiving location during the winter seasons. The further north a ship sails, the more the temperatures drop and simply becomes too cold to venture through.
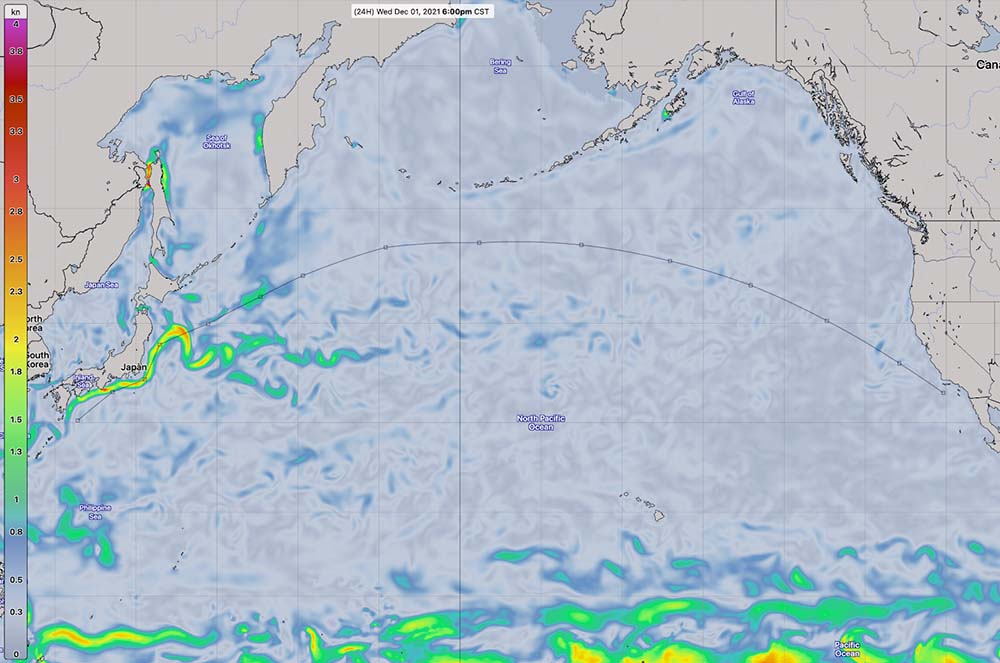
Normally, vessels will reach the United States by applying the Great Circle track navigation principle. As you’ll observe from the graphic above, this will diminish the distance the ship needs to travel but requires the ship to sail further to the north, closer to where there are more perilous weather systems, especially during the winter months.
Historical weather data can identify potential triggers
A year ago, the Apus One, embarked on its journey from China to Long Beach, California and lost almost 2,000 containers due to gale-force winds and massive ocean swells. This took place 1,600 nautical miles northwest of Hawaii and incurred losses approximately $200 million. If you’d like to understand this visually, just take a look at Spire’s AIS graphic below that demonstrates the route Apus One utilized.
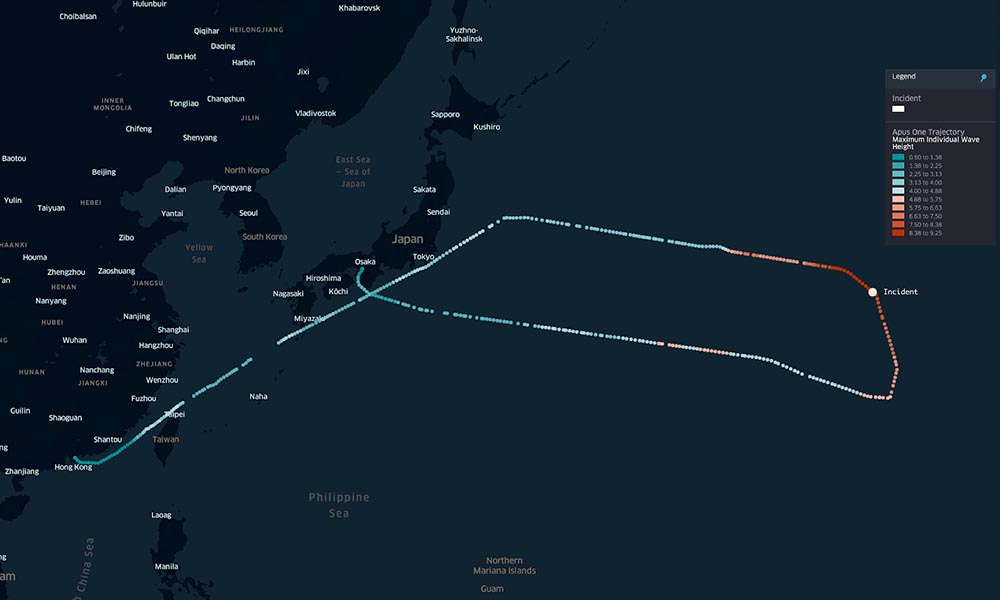
Maximum wave height peaked at around 9.25 meters concurrent with the approximate location of the reported One Apus incident.
Reflecting back in time on such sites to comprehend if there are related atmospheric triggers or, if there is a seasonality to it, can help container ships make decisions in advance to ensure cargo, passenger and ship safety. Analyzing historical weather data along a route of waypoints, i.e., high risk trajectories, will pave the way for fuel optimization as well as reducing carbon emissions. Shorter sailing routes use less fuel to stay on schedule, but straying into latitudes further North can, and do, result in cargo being lost overboard.
These are only a few examples of how historical weather data can help run more efficient operations. Download our free data sample to get hands-on experience using our data and feel free to reach out to us any time. We are always happy to hear data story ideas or pull customized data sets to help you with your industry challenges.