El Niño is officially here. Here’s how businesses can stay ahead
Meghan Mussoline
Product Marketing Manager, Spire Weather and Climate
The climate phenomenon poses several weather-related risks for energy and commodity trading, agriculture, and the insurance industry.
However, space-based data gives businesses the edge to get ahead of its impacts, through accurate global weather forecasts and Soil Moisture Insights with near-real-time data.
El Niño has officially developed in the tropical Pacific as of June 2026, according to the National Oceanic and Atmospheric Administration (NOAA), which issued an El Niño Advisory. The pattern occurs when sea-surface temperatures are above normal across the central and eastern Pacific Ocean, centered around the equator, and it has major implications for the weather patterns around the globe. Widespread extreme heat and rainfall patterns resulting from El Niño can drive significant business impacts across the energy and commodity trading, agriculture, and insurance sectors.
The pattern is expected to strengthen through the Northern Hemisphere fall and winter 2026-27, with a notable chance (around 63%) of becoming a “very strong” event (sea surface temperature anomalies exceeding +2.0°C in the Niño-3.4 region), according to NOAA. The previous strongest El Niño years were 1982-83 (+2.8°C), 1997-98 (+2.5°C), and 2015-16 (+2.6°C). Current projections suggest a most likely range of +2.2-2.8°C for 2026-27. This would rank it among the strongest on record.
“We need to prepare for a potentially strong El Niño event – which will exacerbate drought and heavy rainfall and increase the risk of heatwaves both on land and in the ocean. The most recent El Niño, in 2023-24, was one of the five strongest on record and it played a role in the record global temperatures we saw in 2024,” the World Meteorological Organization (WMO) Secretary-General Celeste Saulo said, according to a recent press release.
While no two El Niños are created equal, there are several common impacts that can play out during an El Niño event.
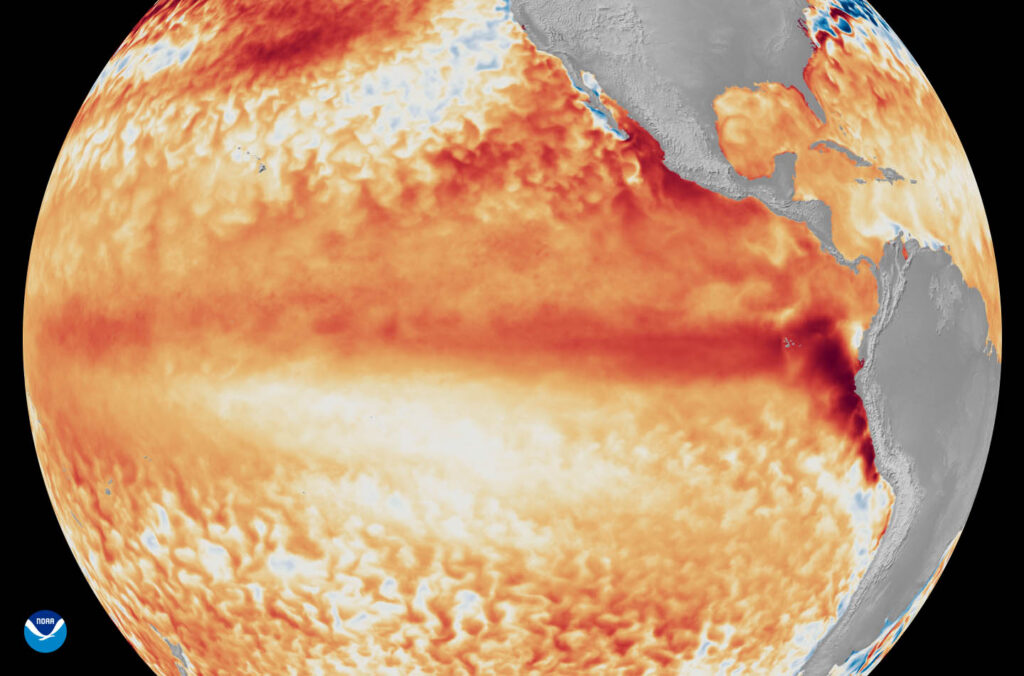
Sea surface temperature anomalies across the equatorial tropical Pacific Ocean during the first week of June 2026. Warmer-than-average waters are highlighted in shades of red and orange relative to NOAA Coral Reef Watch’s historical baseline. (Image credit: NOAA Satellites)
Worldwide weather impacts typical during El Niño
Increased heat waves across the globe can increase cooling demand and spike electricity use. In addition to causing public health concerns, elevated heat could create high-stakes scenarios for energy traders and increase the risk of wildfires, potentially leading to a rise in insurance claims.
El Niño tends to elevate trade winds across the Atlantic Ocean, hindering the development and strengthening of hurricanes in the basin. While this is generally the case, strong tropical storms and hurricanes can still be impactful during El Niño years. Hurricane Agnes, a storm that unleashed destructive and costly impacts in the United States in 1972, is an example of that.
On the other hand, hurricane activity tends to increase across the central and eastern Pacific Ocean, with ample ocean heat content to sustain the budding and strengthening of tropical cyclones.
In the United States, wetter-than-average conditions typically develop in California and across the southern tier of the country. Drier-than-average conditions typically occur across the northern tier. Drought conditions could worsen across key Midwest growing regions, impacting crop production for staples like corn and wheat, and portions of the Northeast.
El Niño tends to suppress the monsoon across South Asia, including India, and cause drier-than-average conditions in Australia. Drought risks in key producing regions could reduce yields of rice, wheat, maize, palm oil, and sugar in Asia and Australia. Extreme heat in southeast Asia during the 1997-98 El Niño caused a 45% global price increase of cocoa, according to the International Monetary Fund.
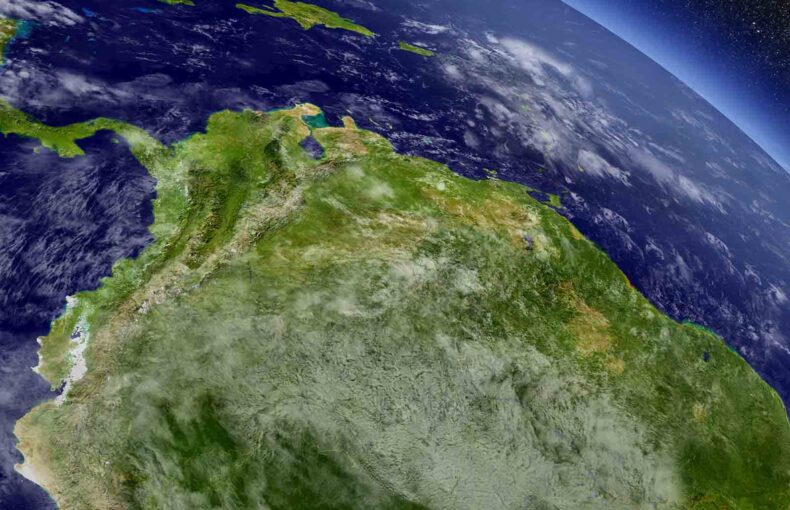
Northern parts of South America, which span key coffee-growing regions of Brazil, are likely to receive below-average rainfall and could be vulnerable to growing drought conditions. Meanwhile, parts of Argentina and Chile can receive more rainfall than average during an El Niño year.
Below-average rainfall typically occurs across the equatorial west and Horn of Africa during El Niño, while other regions of Africa experience above-average rainfall. During the strong El Niño years of 1982-83, cocoa prices surged 55% due to significant drought.
El Niño impacts to global weather are often even more pronounced during the winter season. Global commodity markets are impacted by multiple factors, including tariffs, supply/demand economic and geo-political factors, and local to large scale weather and climate impacts. Strong El Niño years can further apply upward price pressure across commodity markets alongside other global risks.
Spire’s AI-driven sub-seasonal forecasts enable businesses to plan ahead
With an El Niño driving increased business risk, an accurate model that offers industry-ready probabilistic forecasts out to 6 weeks can make all the difference in business outcomes.
El Niño modifies global weather regimes by weakening the equatorial Walker Circulation and shifting mid-latitude jet streams, resulting in major, large-scale shifts to regional temperature and precipitation patterns, according to a 2025 study published in Nature Communications. These adjustments drive persistent alterations in atmospheric circulation, dictating regional storm tracks and extreme weather risks, a research article in the International Journal of Climatology concluded.
Spire’s AI-S2S model is a 200-member generative AI ensemble, built fully in-house, independent of public sub-seasonal models. In a recent validation, Spire’s AI-S2S 2-meter temperatures and 500-mb heights were verified to outperform ECMWF’s sub-seasonal-range (S2S) forecasts* across all forecast lead times, most notably during weeks 3-6, when other models trend toward climatology.
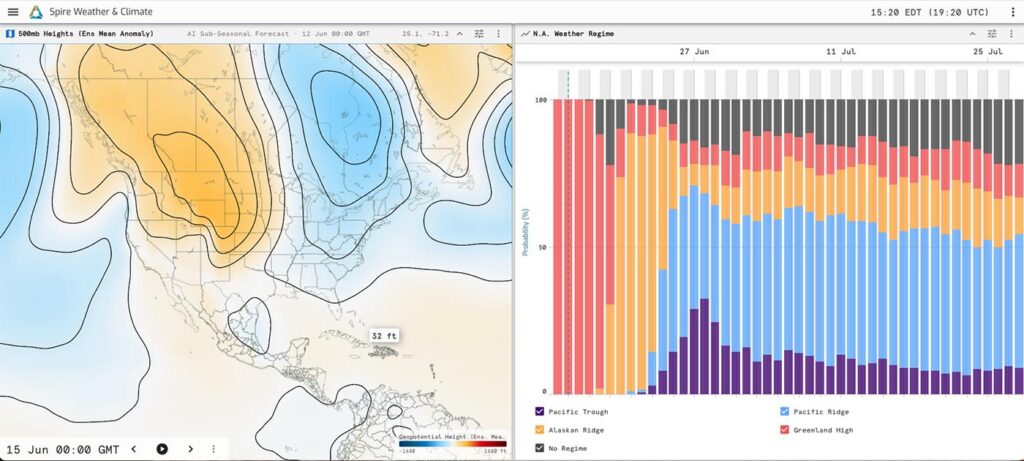
Left: Spire AI-S2S 500 mb Geopotential Heights (Ensemble Mean Anomaly). Right: Spire AI-S2S’s probabilistic weather regime predictions for North America.
The 46-day forecasts are refreshed daily and include anomalies from climatology, ensemble mean, standard deviations, percentiles, probabilities, and weather regimes.
For energy traders, agricultural leaders, and underwriters, probabilistic forecasts help quantify tail risks such as heat waves and the clustering of likely scenarios. For instance, energy traders can price demand and hedge risk weeks in advance, optimizing P&L.
Soil Moisture Insights help industry leaders monitor extremes
Due to the notable rainfall extremes during El Niño, our soil moisture intelligence, spanning 40 years of historical data, near-real-time data, and long-range forecasts, provides an edge for commodity traders, AgTech, agribusinesses, and insurers.
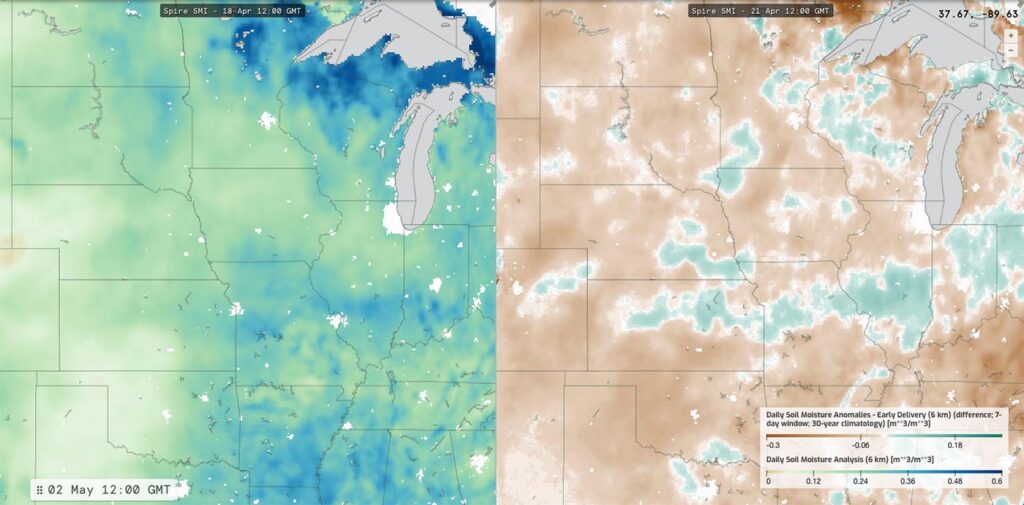
Left: Spire’s near-real-time Soil Moisture Insights (6-km resolution) over the U.S. Midwest. Right: Spire’s soil moisture anomalies from climatology for the same region.
Our satellite-derived soil intelligence highlights climatological anomalies, offering critical insights into soft commodities, crop risk, and wildfire risk, and providing earlier insights into drought and flooding hazards.
Learn more about Spire’s solutions for energy traders
Learn more about Spire’s solutions for agriculture
*Spire conducted independent validation of data from its AI-S2S model, outside of the training and fine-tuning period, against ECMWF forecast data from January 1 – February 15, 2026. The ECMWF data used in this validation is published under a Creative Commons Attribution 4.0 International (CC BY 4.0) license. These results are based on data and products of the European Centre for Medium-Range Weather Forecasts (ECMWF) – ©2026 European Centre for Medium-Range Weather Forecasts (ECMWF). Source ecmwf.int.