Introducing Spire’s Soil Moisture Insights Anomalies: Contextual intelligence for critical decisions
Soil moisture plays a pivotal role in agriculture, water management, financial risk markets, and disaster preparedness, serving as a foundation for understanding weather and climate impacts.
Spire Global’s new Soil Moisture Insights (SMI) Anomalies product revolutionizes how industries interpret soil moisture conditions by comparing current data to long-term climate records, highlighting deviations from the norm through actionable metrics.
What sets SMI Anomalies apart?
Building on Spire’s Soil Moisture Insights, which already delivers accurate, high-resolution soil moisture data, the new SMI Anomalies product introduces historical context and advanced analytics. Soil moisture data is derived from Spire’s proprietary GNSS-R collections, leveraging Spire’s satellite constellation. Additionally, Spire’s soil moisture climatic archive extends back to 1978 using the ESA Climate Change Initiative (CCI) data. This dataset is used to cross-calibrate Spire’s historical soil moisture records, creating a seamless, statistically consistent climate dataset from 1978 to the present.
By combining next-generation satellite technology with AI and machine learning, Spire delivers unmatched accuracy and consistency, enabling users to analyze trends with confidence and precision.

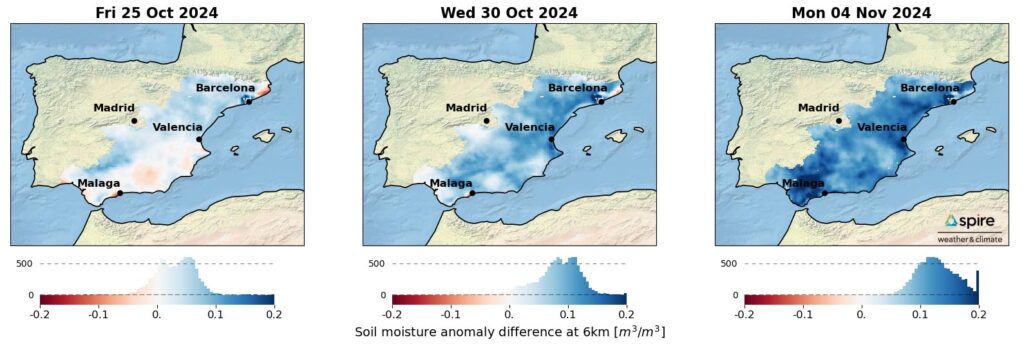
Maps illustrate SMI Anomalies in southern and eastern Spain before, during, and after severe flooding in late October to early November 2024. The 6 km resolution anomalies are based on a seven-day rolling window compared to a 10-year climatological median. The left map shows conditions five days before the event, the center map captures the event, and the right map highlights persistent wet soil moisture five days afterward.
Key features of SMI Anomalies
SMI Anomalies provides unparalleled context with three essential metrics:
- Delta from the median – quantifies how current soil moisture differs from historical medians, revealing significant deviations
- Percentile rank – ranks current conditions within long-term records, pinpointing extremes from the climatic record
- Agricultural Drought Index – tracks the consecutive days of soil moisture deficit, indicating the severity and duration of drought conditions and offering a powerful tool for drought analysis
These features deliver actionable insights to industries reliant on soil moisture data, enabling data-driven decisions that enhance planning and resilience.
Why SMI Anomalies matter: Transformative benefits across industries
SMI Anomalies allows industry users to interpret the data against the climatic backdrop, providing context by highlighting deviations from long-term soil moisture norms. This is critical for identifying extremes, such as early warnings for droughts or floods, and understanding their severity and duration.
SMI Anomalies offers critical insights across multiple sectors. For example:
- Agriculture: Farmers gain an edge with early warnings of soil moisture deficits and monitoring of the Agricultural Drought Index, enabling precise irrigation planning and early responses to drought conditions that threaten crop yields
- Water resource management: Authorities can identify regions with persistently saturated soils and flood-prone areas, helping optimize reservoir management and disaster preparedness
- Commodity trading: Traders can incorporate soil moisture anomalies as leading indicators for crop yield, influencing commodity pricing
- Insurance: Insurers can use anomaly metrics to assess risk and adjust coverage strategies for weather-dependent sectors
From detecting flood risks to enhancing financial strategies, SMI Anomalies empowers stakeholders with precise weather and climate intelligence tailored to their needs.

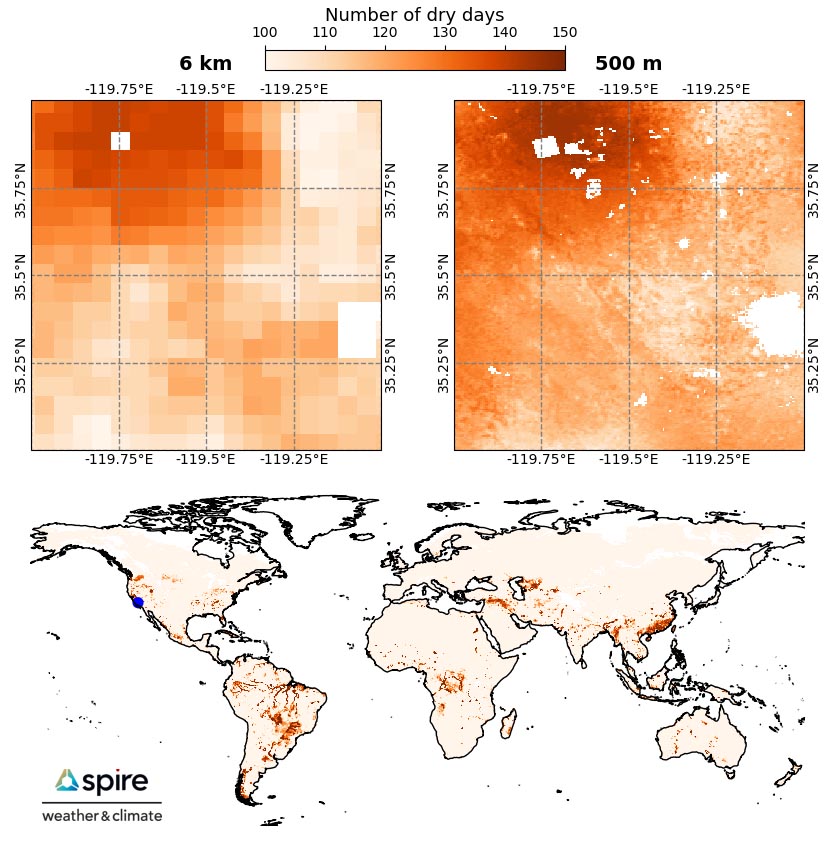
The Agricultural Drought Index shows the number of dry days from January 1 to June 1, 2021, for a location in California south of the Bay Area (marked by the blue dot on the global map) during a major Western US drought. The 10-year median serves as the climatological reference. Upper subplots compare 6 km resolution data (left) with 500 m resolution data (right), highlighting broader regional analysis and field-level detail for agricultural practices. The data reveals long-lasting drought conditions with more than three months of dry days, depicted by red shading in the north.
Flexible resolutions for diverse applications
SMI Anomalies are available at 6 km and 500 m, providing flexibility to support a range of use cases across industries.
- 6 km resolution: Ideal for identifying large-scale soil moisture trends and anomalies; this supports applications such as climate analysis, drought prediction, commodity trading, and insurance risk assessments, where broad-scale insights are essential for understanding potential financial impacts of droughts or floods
- 500 m resolution: Designed for local and field-level insights, this resolution is particularly valuable for precision agriculture, irrigation management, and flood monitoring; granular details optimize decision-making
Seamless access through API and advanced visualization
End users can access SMI Anomalies through the Soil Moisture Insights API and the DeepInsights™ Cirrus visualization solution, offering flexibility for diverse applications.
- API access: Retrieve soil moisture anomalies as point or raster data for location-specific or regional insights
- Point requests: End users can extract time series of soil moisture and anomalies at specific locations with a single API request, enabling quick analysis of historical and current conditions
- Gridded data: Regional insights into deviations from climatic norms can be assessed using raster data, supporting broader-scale analysis and visualization
- DeepInsights Cirrus visualization: Within Cirrus, users can explore anomalies through interactive regional maps, providing spatial context for deviations in soil moisture; for detailed temporal insights, meteograms allow users to analyze soil moisture trends and anomalies over time at specific locations
This combination of granular data and broad-scale visualization ensures users have the tools they need to make informed decisions quickly.

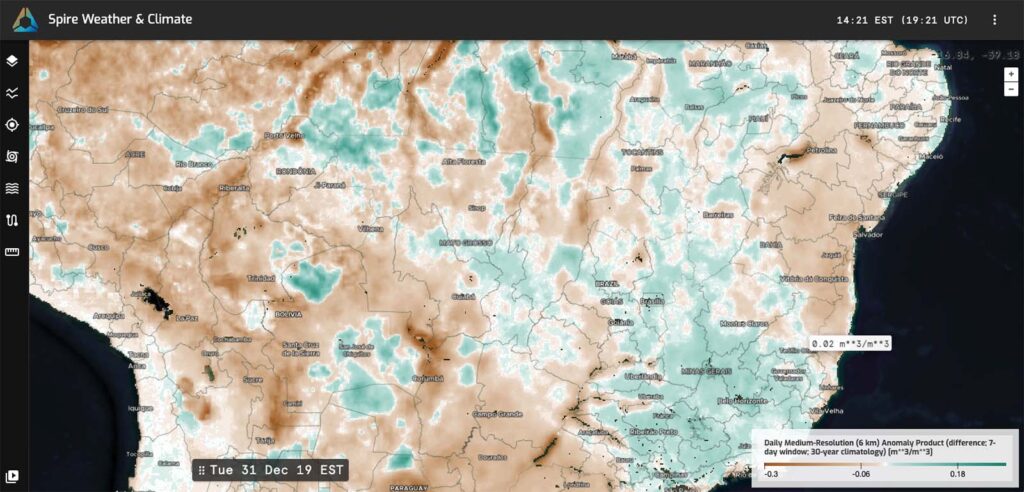
Coffee prices surged to a 47-year high in late November due in part to adverse weather disrupting crop production in Brazil, the world’s largest producer of arabica beans. Brazil faced its worst drought in 70 years, followed by heavy rains since October. Spire’s Soil Moisture Anomalies show slightly above-average soil moisture conditions in Minas Gerais, Brazil’s primary growing region for arabica beans, in late December.
Unlock the power of context
With the release of SMI Anomalies, Spire Weather & Climate contextualizes soil moisture data against long-term climate records. These insights help industry users anticipate risks, optimize resources, and remain resilient in a changing climate.
Explore the possibilities of SMI Anomalies today and experience how Spire’s technology can empower your decisions.
 Written by


