Darling Analytics empowers commodity traders with a real-time, global picture of maritime logistics using satellite AIS data
- Introducing Darling Analytics
- Challenge: Lack of standardized processes to access, manage, and analyze maritime data for the commodity trading industry
- Solution: Integrating real-time satellite AIS data with large language models
- Impact: How commodity traders can utilize the data from Spire Maritime combined with insights from Darling Analytics
Darling Analytics is a revolutionary technology for the oil, gas, & shipping industries, specifically tailored to the needs of commodity traders.

Introducing Darling Analytics
Their platform-neutral software can be tailored to any API data set and allows users to integrate Darling Analytics into their company’s proprietary data sets to access continuous, real-time data on demand. With their LLM (Large Language Model) software, users can ask Darling Analytics questions about their data and retrieve detailed answers and analysis within minutes.
Challenge: Lack of standardized processes to access, manage, and analyze maritime data for the commodity trading industry
Manually handling big data is extremely time consuming and inefficient. The oil, gas, and shipping industries have vast amounts of data including refinery flows, market and pricing metrics, macroeconomic information, and maritime data, yet there lacks a standardized industry approach to handling these data points.
Within the commodity trading industry, understanding maritime operations is key to conducting successful business transactions and staying ahead of the market. It can be challenging to keep tabs on a cargo’s whereabouts as a vessel may be subject to delays or operational changes that may affect its route or ETA. Surprisingly, many oil and gas companies do not have access to live satellite data, so traders must rely on marine operations or vessel agents to get updates on their vessel positions and are not able to quickly obtain this information at their own discretion.
Darling Analytics wanted to solve this challenge and help their users obtain a global picture of maritime logistics at the click of a button.
“We needed real-time AIS data to be ingested in our software to provide our users with an up-to-date and accurate view of the world’s shipping activities.”
Share on Facebook Share on Twitter Share on LinkedIn
Solution: Integrating real-time satellite AIS data with large language models
Darling Analytics has leveraged Spire Maritime’s real-time satellite data to enhance their platform and provide users with up-to-date vessel information, including vessel signals (the current location of the vessel), port ETAs, and vessel speeds. With this information, users can become more autonomous in their operations and do not have to continuously rely on multiple sources to understand their vessel’s location or ETA. Moreover, users can ask complex batch questions to see the status of vessels across the world, port congestion, or plan a hypothetical voyage using real-time vessel speeds.
Implementation in action: Laden tankers en route to Europe – Batch processing query with ETAs
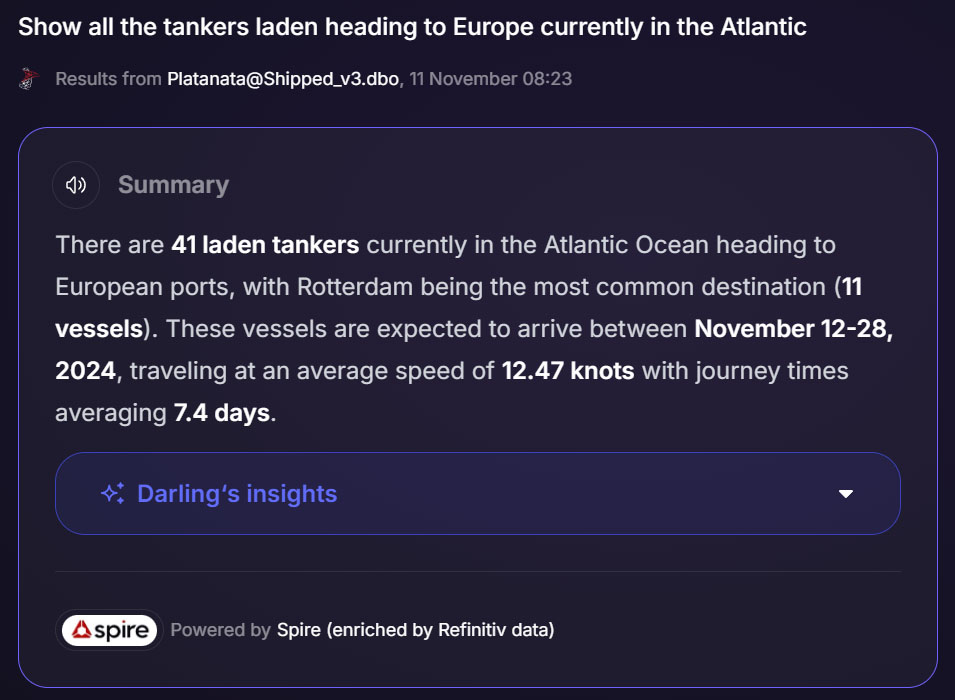
Question: Show all the tankers laden heading to Europe currently in the Atlantic.
Darling Analytics’ Answer: There are 41 laden tankers currently in the Atlantic Ocean heading to European ports, with Rotterdam being the most common destination (11 vessels). These vessels are expected to arrive between November 12-28, 2024, travelling at an average speed of 12.47 knots with journey times averaging 7.4 days.

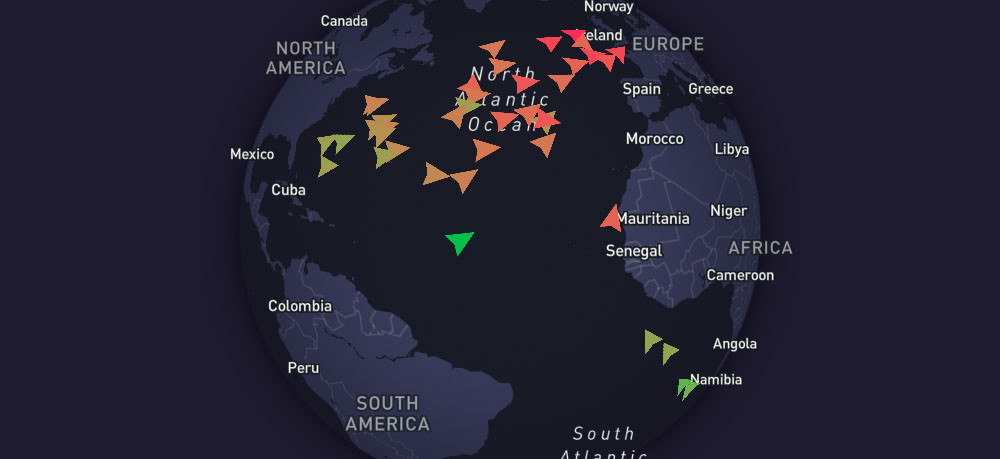
Real-time, AI-generated map of all tankers laden in the Atlantic, en route to Europe
Batch processing real-time data:
Batch processing refers to the method of processing large amounts of data at once and allows the Darling Analytics software to analyze multiple vessel signals and return insights within a matter of minutes. This makes the software extremely powerful as manually collecting and computing these insights would take hours or require python programming from an IT specialist.
The above question is an example of how Darling AI can batch process Spire Maritime data to provide the user with a real-time, interactive map and analysis of a specific set of ships. In this case, the question refers to all laden vessels in the Atlantic heading to Europe, however these specifications can be changed at any point to suit the user’s requirements.
Gathering context:
Upon answering the question, Darling Analytics not only visually displays the tankers in the map as pictured, but also returns detailed data points derived from the Spire Real-Time and Enhanced AIS Data, such as port ETAs and destination points, average vessel speeds, and average days to ETA. The ‘Darling’s Insights’ breakdown provides users with further details of information that may be helpful to them, including analysis on the variation in vessel speeds, and details on the geographical distribution and concentration of vessels across the Atlantic.
The Darling Analytics software does not simply take Spire Maritime data and return it at face value; rather, it puts the data into context. Instead of simply telling the user the average vessel speed of 12.47 knots, Darling Analytics also tells the users the variance in vessel speeds, with examples of the Koksijde vessel leading the distribution with 18.1 knots, and the White Moon and Seaodyssey at the back of the distribution with 9.2 knots. Users can further iterate on any response, asking Darling Analytics more questions until they get the information required.

Screenshot of the Darling Analytics Platform with AI-generated answer and detailed insights
Impact: How commodity traders can utilize the data from Spire Maritime combined with insights from Darling Analytics
The example above demonstrates how commodities traders can use the platform with Spire data to analyze freight utilization on a global scale, leveraging a real-time picture of vessels en route to a destination, and also in understanding what port congestion is looking like at the destination point of choice.
Users can monitor any vessel route or geographical location by adding it to their custom Power BI dashboard, allowing them to have a holistic view of whatever suits their business needs. Users can also set alerts to be notified via email of key metrics that they want to flag. For example, if there are more than 10 LPG vessels leaving laden from Africa to Europe at any given point in time.
“Thanks to Spire Maritime’s data, our users can benefit from the ability to identify trends in trade routes, port calls, and shipping lanes which provide insights into emerging markets, shifting trade patterns, and global supply chain dynamics.”
Share on Facebook Share on Twitter Share on LinkedIn
Learn more about Real-time and Enhanced AIS data
Spire’s Real-time AIS is based on an interconnected satellite architecture to provide real-time coverage and instant visibility into maritime activities, in the open ocean and near shore. Enhanced Satellite AIS is complimentary to Standard AIS and Real-Time AIS and offers premium coverage in high traffic zones.
Contact our team to know how you can leverage our AIS data for your specific use case.