Improving carbon emission estimates with space-based ADS-B data and upper wind component integration
- Introduction
- Use of space-based ADS-B data to reconstruct flight trajectories
- The role of forecasted upper wind in the carbon emission analysis
- Reducing the uncertainty in carbon emissions estimations by combining Spire aviation and weather data
- Clear correlation between wind and CO2 flight emissions
- Conclusion
 Written by
Dr. Junzi Sun
Faculty of Aerospace Engineering
It’s been over a hundred years since the first powered airplane soared in the skies in December 1903, revolutionizing the way humanity travels.
The Wright brothers’ groundbreaking achievement unlocked new possibilities for long-distance travel and opened up previously unattainable horizons for exploration, trade, and communication across continents and oceans. Since then, air travel has become an integral part of our global transportation system, revolutionizing the way we connect, conduct business, and experience the world.
However, the year 2022 marked a record-breaking year with climate change wreaking havoc across the globe with an increasing number of heatwaves, droughts, storms, and other harsh weather events. The time has come for humanity to unite to address the impact of climate change and to take action to reduce carbon emissions. According to the International Air Transport Association (IATA), in 2019, air travel between Europe and the US generated approximately 51.7 million metric tons of carbon dioxide (CO2) emissions, which accounts for approximately 2% of global CO2 emissions.
Check the impact of reduced air traffic during pandemic had on the carbon emissions
In addition to ongoing endeavors to enhance aircraft fuel efficiency and explore alternative fuels, it is crucial to acknowledge the significant impact that weather, particularly wind conditions, can have on aircraft emissions. Weather, particularly wind patterns, plays a pivotal role in flight planing and significantly affects the level of carbon emissions generated by aircraft.
The collaboration between Delft University of Technology (TU Delft) and Spire Global seeks to investigate the correlation between flight emissions and weather conditions, specifically the upper wind component, for flights traversing the North Atlantic Ocean. The upper wind component refers to the wind speed and direction at high altitudes, which plays a crucial role in influencing aircraft performance and fuel consumption. The study aims to shed light on the impact of these weather factors on aviation emissions and provide valuable insights for future aviation sustainability efforts.
The carbon emission calculation process utilized in this study was developed as a component of a comprehensive research project spearheaded by Dr. Junzi Sun, a distinguished aviation researcher at the Faculty of Aerospace Engineering at TU Delft.
The process incorporates reconstructed 4D flight trajectories obtained from ADS-B (Automatic Dependent Surveillance-Broadcast) data collected by Spire LEMUR satellites over the Atlantic Ocean, as well as terrestrial ADS-B data from OpenSky Network, and forecasted upper-wind data from Spire’s historical weather forecast.
By understanding the relationship between weather conditions and carbon emissions, the partnership hopes to identify opportunities to reduce CO2 emissions and improve the sustainability of air travel.
Use of space-based ADS-B data to reconstruct flight trajectories
To truly understand the correlation between the forecasted upper wind and CO2 emissions, the first step was to collect flight traffic data from flights between the US and Europe for the month of March over three consecutive years: 2020, 2021, and 2022. By analyzing this data, the team was able to capture east and west-bound flights over the Atlantic Ocean and reconstruct their complete flight trajectories.
This intricate process entailed collecting data points from all aircraft traversing the Atlantic Ocean, utilizing Spire satellites to accurately connect and construct the complete flight paths. The significance of space-based ADS-B data is particularly emphasized in remote areas like oceans, where traditional terrestrial data collection methods are not feasible.
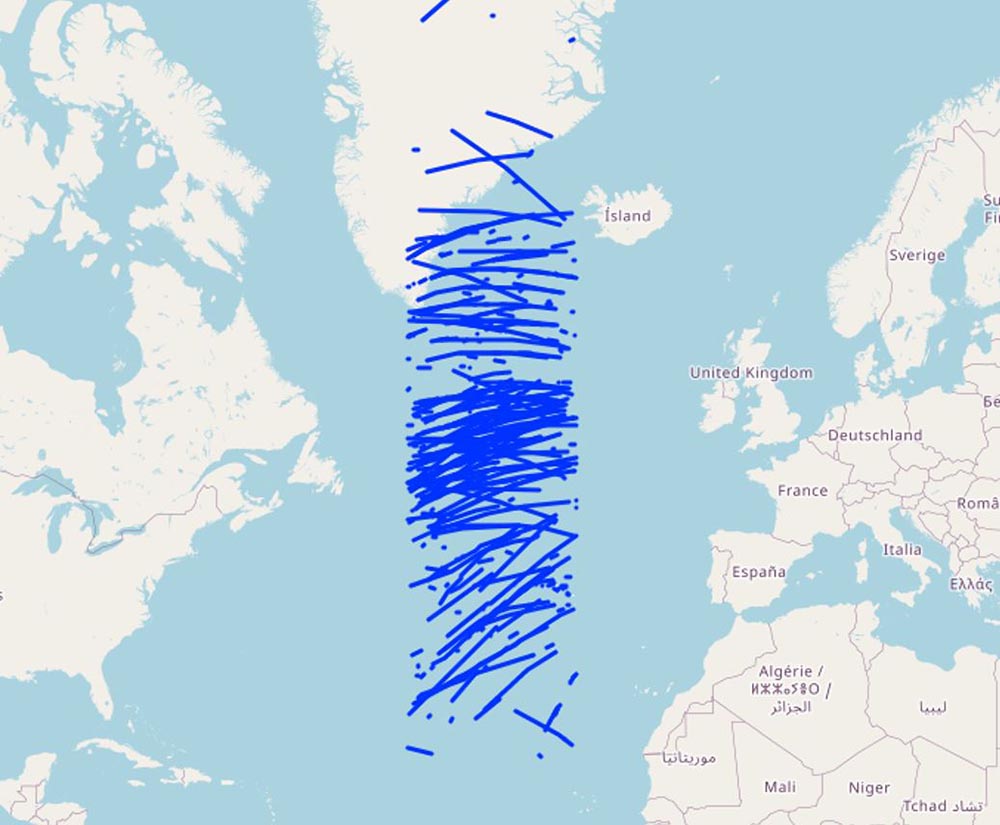
The collected flight routes were incorporated into a reconstruction algorithm alongside other flight datasets to extend the detected flight trajectories over the entire remote area of the Atlantic Ocean.
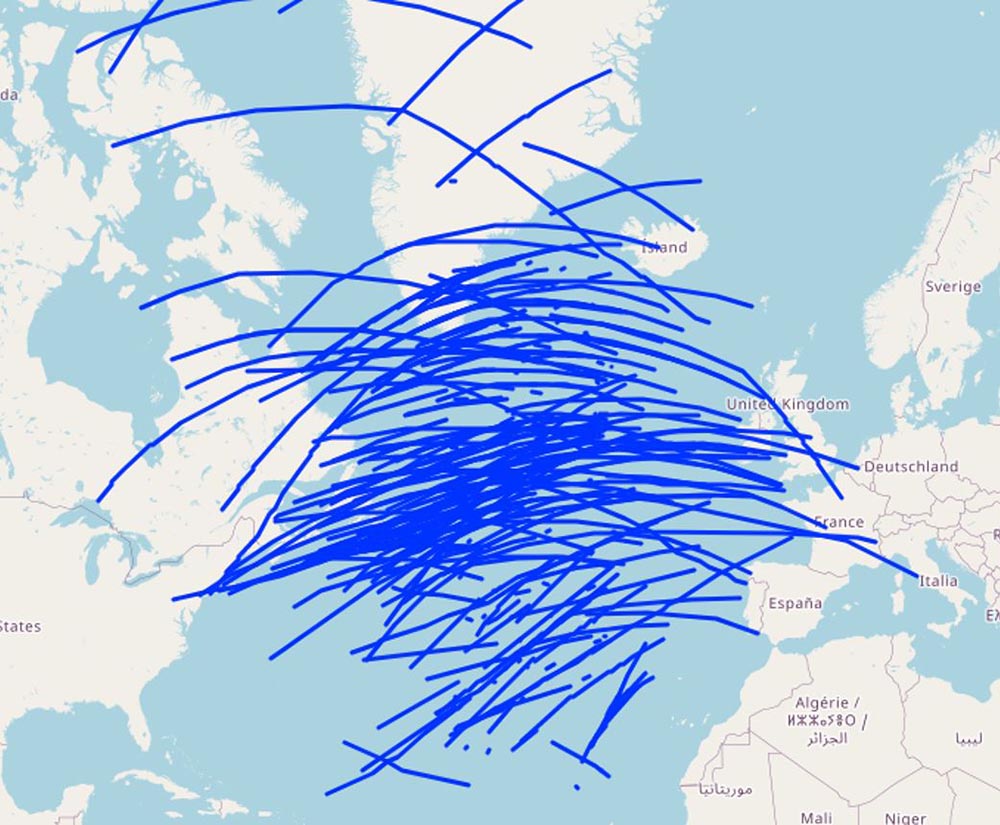
However, to obtain complete airport-to-airport flight trajectories, the terrestrial ADS-B dataset from OpenSky was also incorporated into the algorithm. The result was a comprehensive map of both east and westbound flights between the US and Europe, incorporating 21,487 flight trajectories, out of which 51% were eastbound flight paths and 49% westbound flight paths, with filtering out incomplete trajectories.
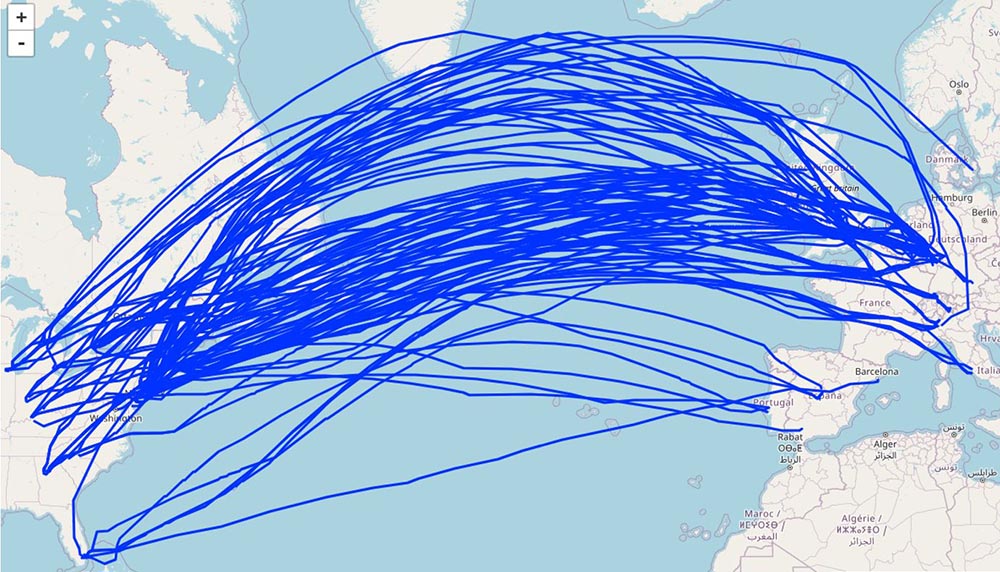
Visualized with the open-source library: traffic-viz.github.io
The role of forecasted upper wind in the carbon emission analysis
Once the flight paths were established, the research team was able to calculate the carbon emissions of each flight by using the OpenAP model. OpenAP is a fully open-source aircraft performance and emission model, which was created by Dr. Junzi Sun in 2019 and being quickly adopted in aviation research.
In the analysis, carbon emissions were compared based on ground speed broadcast in space-based ADS-B messages and approximated airspeed, which took into account the upper wind component from Spire Weather. The inclusion of wind in the calculations is crucial due to the notable presence of strong and persistent westerly winds, known as the Jet Stream, in the North Atlantic. The Jet Stream is a high-altitude wind that can exceed speeds of 200 miles per hour, flowing from west to east across the Atlantic Ocean. While it can provide a tailwind for eastward flights, it can also cause turbulence and increase flight times due to headwinds for westward flights.
In addition to these weather characteristics, flights operating over the North Atlantic must also contend with the effects of the Gulf Stream, a warm ocean current that flows from the Gulf of Mexico to the North Atlantic. The Gulf Stream can create significant temperature and humidity gradients, leading to the formation of thunderstorms and other weather phenomena.
The analysis considered various data points in addition to forecasted upper wind conditions, including flight routes, aircraft types, altitude, and airspeed. To calculate emissions, the take-off masses of the aircraft were assumed to be approximately 85% of the maximum take-off weight. Here is an example of the dataset utilized to calculate carbon emissions for an eastbound flight.
Eastbound flight data:
| Departure airport: | New York airport (KJFK) |
| Arrival Airport: | Madrid airport (LEMD) |
| Start: | 2020-03-01 22:13:45 |
| End: | 2020-03-02 03:54:45 |
| Duration: | 5h 41min |
| Operating aircraft: | Airbus 330-302 |
| Sampling rate: | 15 seconds |
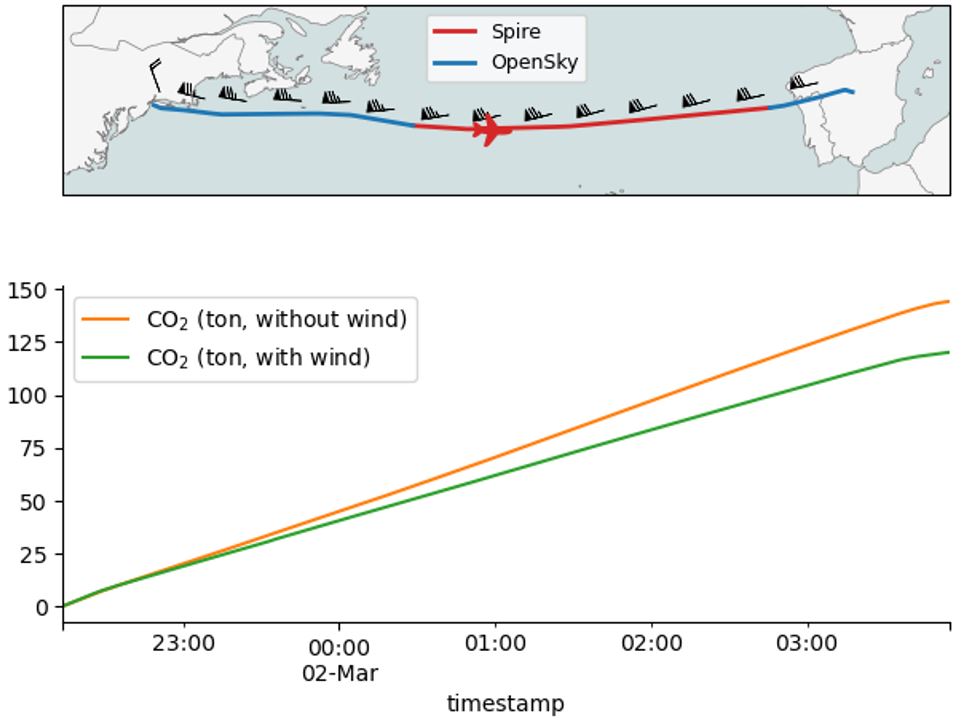
The map (first picture) represents the horizontal flight route taken by the aircraft flying over the North Atlantic Ocean. The second picture shows the detailed altitude flight profile over time, with the Y-axis representing barometric altitude in feet. And the last graph provides a visual representation of the estimated flight CO2 emissions in relation to time. The red line shows the CO2 emissions without considering the forecasted wind, while the green line displays the estimated CO2 emissions considering the forecasted wind along the flight trajectory.
But does the upper wind have the same effect on the westbound flight as well? When analyzing its impact on the chosen westbound flight example, we used the below flight data.
Westbound flight data:
| Departure airport: | New York airport (KJFK) |
| Arrival Airport: | Madrid airport (LEMD) |
| Start: | 2020-03-01 12:00:00 |
| End: | 2020-03-02 19:48:00 |
| Duration: | 7h 48min |
| Operating aircraft: | Airbus 330-302 |
| Sampling rate: | 15 seconds |
| Remark: | Trajectory data outside of coverage is extrapolated |
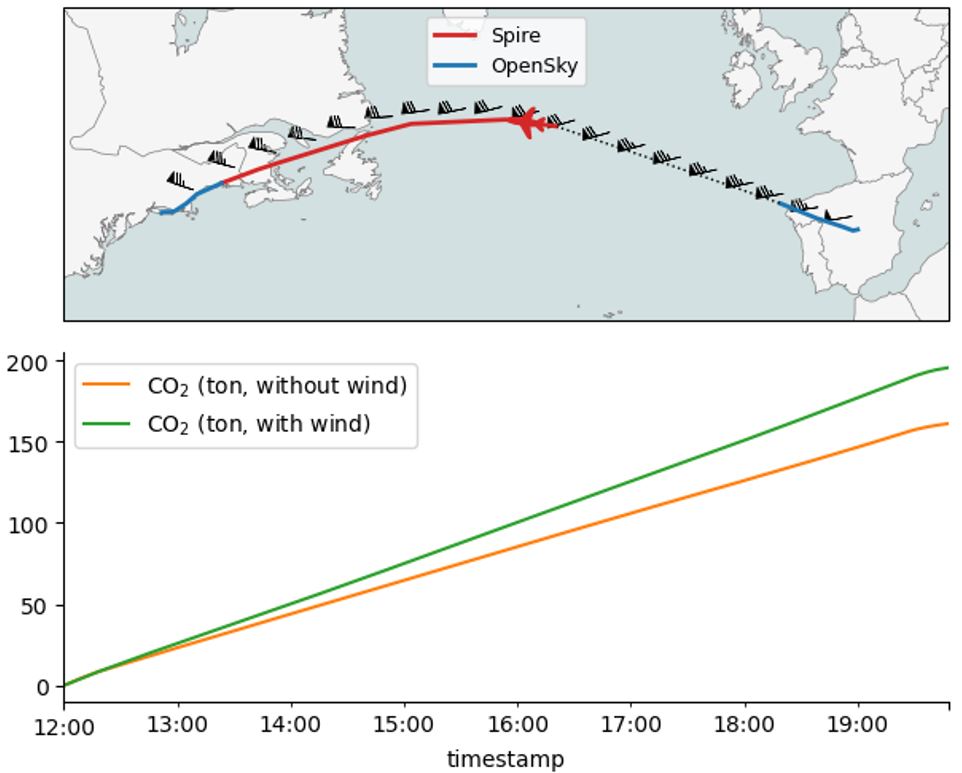
The map on the first picture provides a visual representation of the horizontal flight route by chosen aircraft over the North Atlantic Ocean. The second picture shows a detailed altitude flight profile over time, with the Y-axis representing barometric altitude given in feet. The third visualization, a graph, displays the estimated CO2 emissions of the flight over time. The red line on the graph represents the CO2 emissions without considering the forecasted wind, while the green line displays the estimated CO2 emissions considering the forecasted wind along the flight trajectory.
Reducing the uncertainty in carbon emissions estimations by combining Spire aviation and weather data
Our analysis of space-based and terrestrial ADS-B data combined with Spire Weather data revealed that incorporating the upper wind component into CO2 emissions estimation calculation models could reduce the uncertainty in emissions estimation. Looking more closely at the eastward flights, applying the forecasted wind component into the CO2 emissions estimation model shows less or similar carbon emissions due to tailwind occurrence, contributing to shorter flight time and lower fuel consumption. On the other hand, westward flights tend to generate higher values of carbon emissions as a result of a strong headwind from the North Atlantic jetstream.
Comparing the C02 estimation for relatively the same number of east and westbound flights showed that they are not balancing each other out. Instead, we can see a significant increase in estimated CO2 emissions when the upper wind data forecast is taken into consideration.
Aggregated percentages of CO2 emissions differences per year per direction
| Year | Direction | CO2 difference (%) |
|---|---|---|
| 2020 | eastbound | -0.44% |
| 2020 | westbound | 20.69% |
| 2021 | eastbound | 6.17% |
| 2021 | westbound | 17.26% |
| 2022 | eastbound | 10.11% |
| 2022 | westbound | 22.87% |
| 2020 | any | 10.49% |
| 2021 | any | 11.71% |
| 2022 | any | 16.62% |
Aggregated percentages of CO2 emissions differences per year per direction, taking into account the wind speed
| Year | Flow | Wind | co2 diff % |
|---|---|---|---|
| 2020 | eastbound | x<50 | -2.31% |
| 2020 | eastbound | 50<x<100 | -9.13% |
| 2020 | eastbound | 100<x<150 | -1.97% |
| 2020 | eastbound | 150<x<200 | 14.00% |
| 2020 | eastbound | 200<x<250 | 23.57% |
| 2020 | eastbound | x>250 | NaN |
| 2020 | westbound | x<50 | 3.07% |
| 2020 | westbound | 50<x<100 | 15.59% |
| 2020 | westbound | 100<x<150 | 28.36% |
| 2020 | westbound | 150<x<200 | 29.75% |
| 2020 | westbound | 200<x<250 | 26.38% |
| 2020 | westbound | x>250 | NaN |
| 2021 | eastbound | x<50 | -1.97% |
| 2021 | eastbound | 50<x<100 | -2.71% |
| 2021 | eastbound | 100<x<150 | 1.38% |
| 2021 | eastbound | 150<x<200 | 14.97% |
| 2021 | eastbound | 200<x<250 | 30.78% |
| 2021 | eastbound | x>250 | 30.14% |
| 2021 | westbound | x<50 | 3.61% |
| 2021 | westbound | 50<x<100 | 13.75% |
| 2021 | westbound | 100<x<150 | 20.50% |
| 2021 | westbound | 150<x<200 | 27.04% |
| 2021 | westbound | 200<x<250 | 23.47% |
| 2021 | westbound | x>250 | 23.53% |
| 2022 | eastbound | x<50 | 0.53% |
| 2022 | eastbound | 50<x<100 | -2.92% |
| 2022 | eastbound | 100<x<150 | -1.16% |
| 2022 | eastbound | 150<x<200 | 4.49% |
| 2022 | eastbound | 200<x<250 | 19.40% |
| 2022 | eastbound | x>250 | 25.44% |
| 2022 | westbound | x<50 | 2.57% |
| 2022 | westbound | 50<x<100 | 17.79% |
| 2022 | westbound | 100<x<150 | 23.57% |
| 2022 | westbound | 150<x<200 | 27.68% |
| 2022 | westbound | 200<x<250 | 27.06% |
| 2022 | westbound | x>250 | 25.59% |
The aggregated CO2 emissions estimation difference for all flight trajectories analyzed in this study reveal the 5,96% per year variation in eastbound and 20,70% in westbound flights when considering the upper wind component, contributing to 13,46% overall estimation difference on the level of the study.
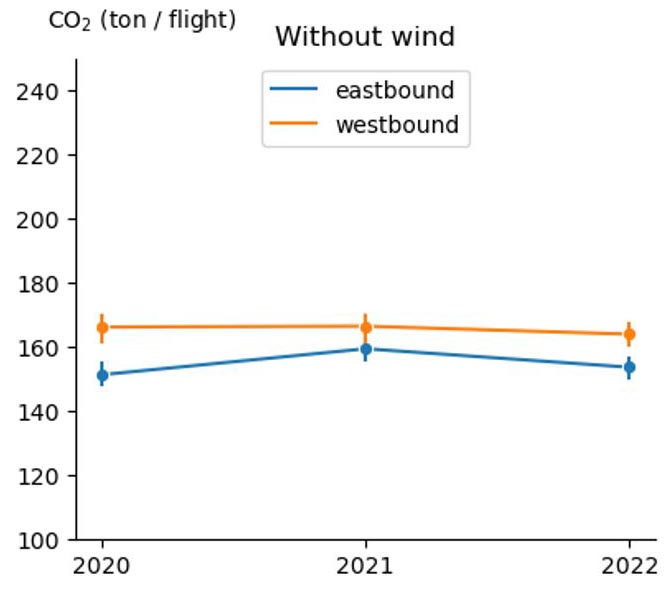
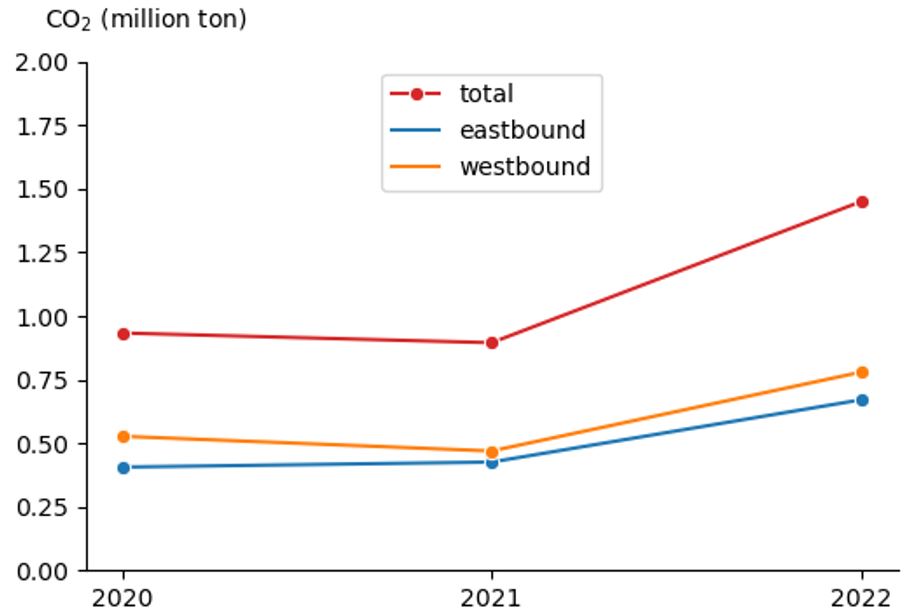
Average trip emissions each year, with and without considering wind in estimation
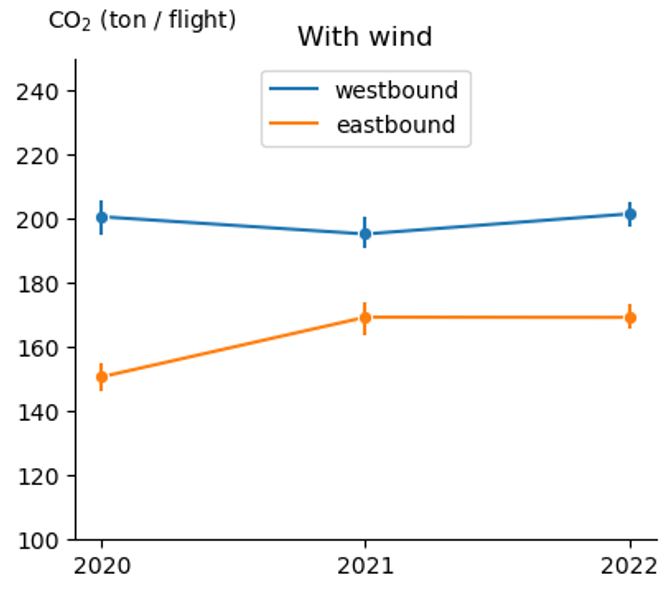
CO2 emissions from the selected set of flights between 2020 and 2022, considering wind (based on the flights in the selected dataset)
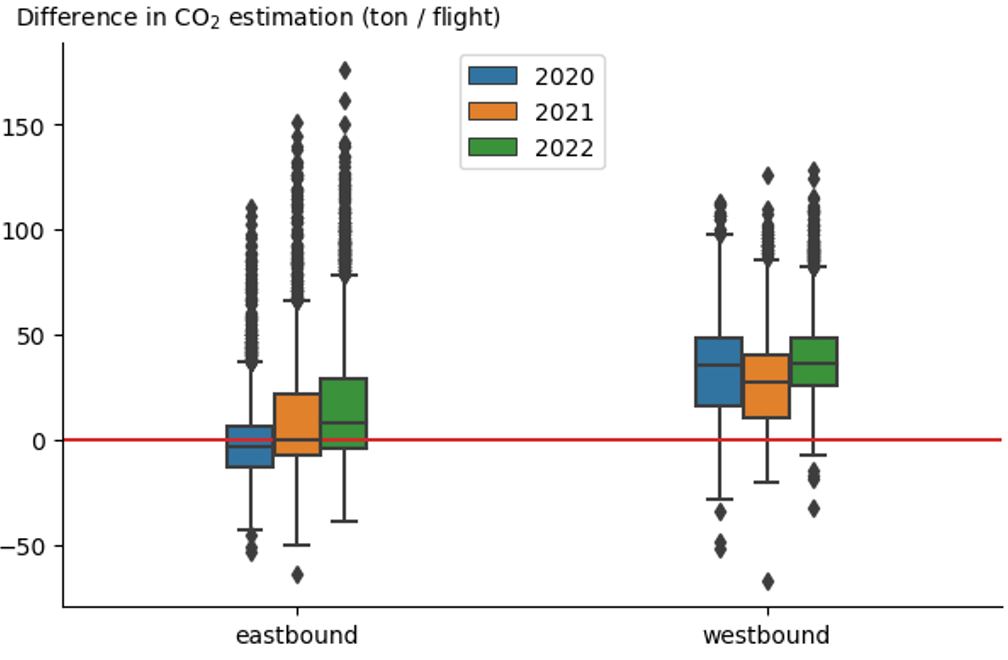
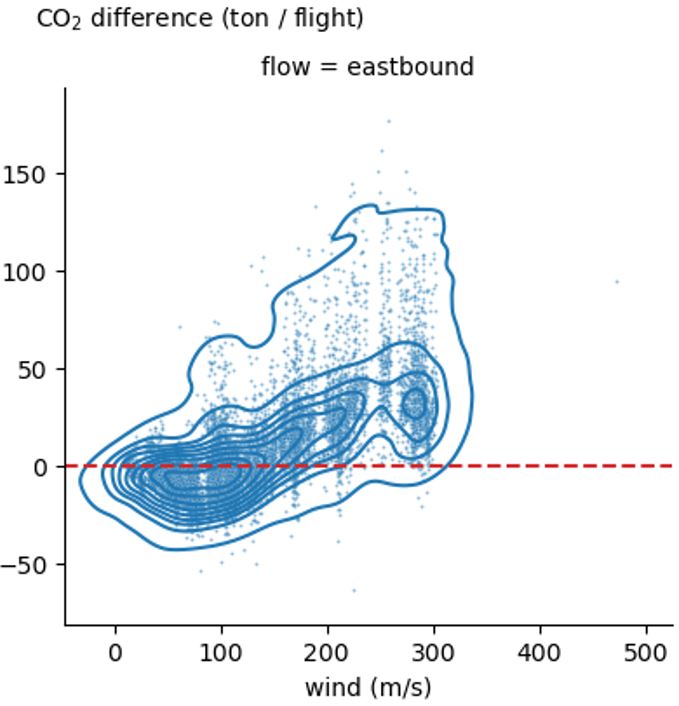
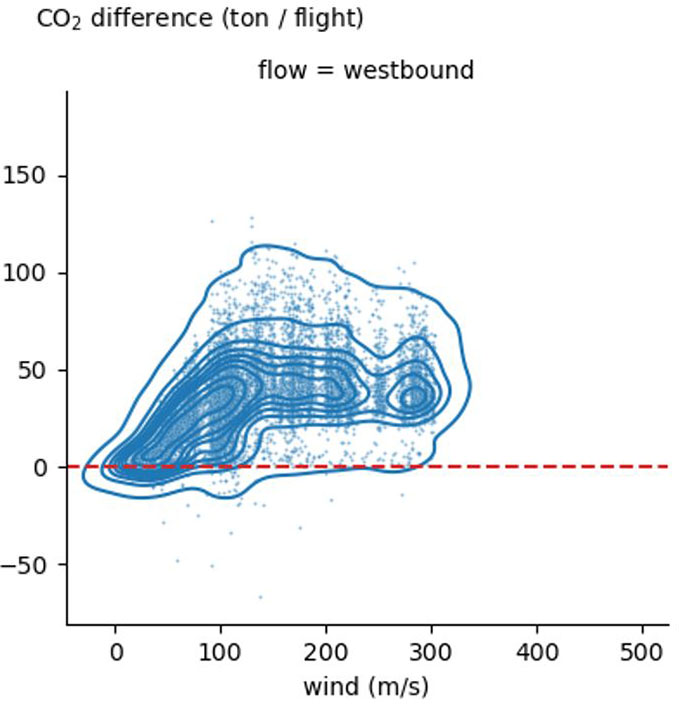
Clear correlation between wind and CO2 flight emissions
The numbers and graphs provided show the impact that wind speed can have on the carbon emissions of flights, denoting a clear correlation between stronger wind and higher CO2 emissions. The graphic below represents this relationship visually from March 2022. The flights over the North Atlantic Ocean are separated by the eastbound and westbound flow, showing the difference in the CO2 estimations when the wind component is taken in to the account versus when it is not considered.
Conclusion
The results of this collaborative study between TU Delft and Spire emphasize the importance of assessing air traffic emissions beyond just the distance traveled, aircraft’s performance characteristics and load factor. By examining a comprehensive dataset of transatlantic flights using Dr. Junzi Sun’s OpenAP model from TU Delft, the analysis revealed that incorporating the upper wind component into carbon emission estimation models improves the accuracy of estimating flight emissions. Moreover, when Spire’s wind data was combined with their space-based ADS-B data, a significant increase in emissions was observed.
The findings highlighted the significance of assessing aviation emissions using space-based ADS-B data and considering weather conditions, including wind speed and direction, and it also demonstrated the potential for accurate emission assessment at the flight level. Future CO2 emissions estimation models will have to take into account the influence of the weather conditions such as wind speed and direction but also temperature and humidity during flights. To achieve a more sustainable aviation future and reduce the industry’s carbon footprint, it is imperative for the aviation sector to account for weather patterns’ impact on flight emissions when formulating reduction strategies.