Six ways historical data is used for offshore planning and construction
 Written by
Maureen Thom
Contributing editor
Offshore infrastructure is increasing and there is an increasing need to manage climate risk when planning, building and operating them.
Project planning and design sectors tap data for cost estimating to save time and resources when compared to engineering studies and environmental reports.The construction industry realized the impact computer-aided design (CAD) software could have in terms of planning and design more than 30 years ago. The emergence of 3D printing continued to move construction planning and design into the next century. The maritime industry too has embraced technology and data as valuable tools for route planning, crew and cargo safety, and to reduce carbon emissions.
Just as CAD software made it possible to build an entire model in a virtual environment, historical data powers ai-driven models which let you build digital twins and highlight patterns and anomalies. Visualizing properties like wave height, wind speed, and currents can help decrease friction on vessels and determine the optimal speed a vessel should travel. Models used for a particular application are changing the way maritime operations function every day.
Here are six ways historical data is used for offshore planning and construction in maritime:
1. Identifying potential wind energy lease areas
The demand for offshore wind energy continues to grow and historical data is vital to identifying potential wind energy lease areas. Developing renewable energy resources requires comprehensive planning and complete environmental analysis, both of which are enabled using historical data. Historical AIS data identifies how waters around existing and planned wind energy lease areas are used. This data includes vessel types, vessel movements, and traffic levels.
2. Estimating costs prior to breaking ground in highly regulated industries
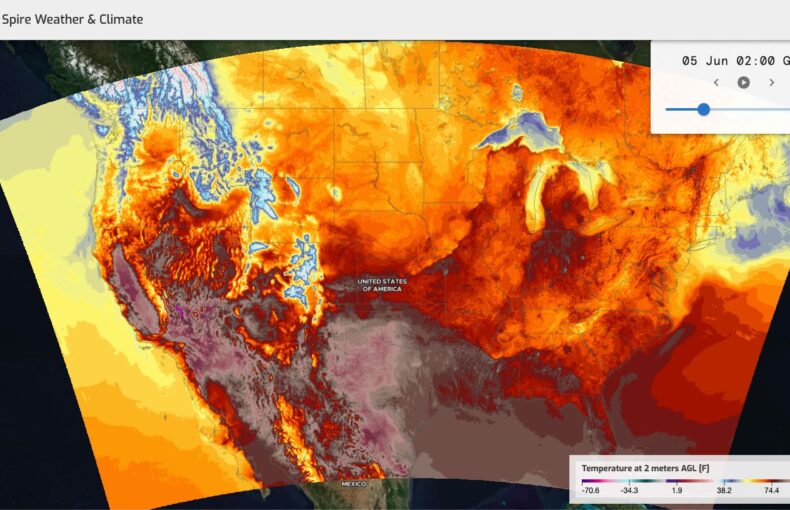
Fixed installations, like oil platforms and other highly regulated markets, require long term planning and analysis to ensure safety, protect ocean ecosystems, and maintain compliance standards. Data can be used to estimate risk, identify challenges, and promote the benefits of planned sites. Historical weather data is particularly useful in this situation, as storm and inclement weather patterns can be identified using historical data and documented early in the site identification process.
3. Building smart ports
As maritime traffic grows and sea routes continue to evolve, ports need a way to accommodate the increasingly large size of vessels and move them through port services more efficiently. Smart ports are the go-to solution to efficiently manage increasing vessel traffic and larger sized ships. These smart ports rely on artificial intelligence and machine learning to estimate future traffic and ensure adequate staffing and equipment.
The pandemic fueled a cargo boom that highlighted the need for the supply chain to manage upticks in cargo volumes. Smart ports are one solution for this as they allow port operators to scale to appropriate levels. The increase in e-commerce also added transparency to the shipping process, which highlighted port delays and cargo losses at sea. Smart ports include this asked-for layer of transparency to show how cargo is managed efficiently.
Smart ports were the topic of discussion at a ‘Ports of the Future’ session during the IAPH World Ports Conference 2021. The recent blockage of the Suez Canal highlighted the importance of predictive analytics to prevent events that disrupt logistic chains. Partnerships that build data transparency with an added emphasis on digital security are key to building ports equipped for managing future vessel traffic.
Additionally, machine learning models are often made stronger by the infusion of historical data, as this data provides the “knowledge” of past events which helps identify growth rates, accurately track the types of vessels entering the port, and determine the length of time vessels were in port. All of which is useful to define new port processes, expand port space, and keep maritime traffic moving.
Customized weather packages adapted to your needs
Our industry-specific solutions are designed to help solve these challenges by identifying the factors that impact your business objectives.
4. Managing supply vessels to ensure safety
Ongoing off-shore operations integrate supply boats to working oil rigs, and as traffic in many areas increases and time becomes more valuable, safety is a top concern. Historical weather data can help improve contribution estimates and plan supply boat usage.
A platform supply vessel can range from 160 to 330 feet long and perform many tasks, with a primary function of logistic support and transportation of goods, equipment, and people to and from an offshore oil platform. Many platform supply vessels use a dynamic positioning system to maintain vessel position and these systems are particularly reliant on wind, wave, and current conditions. Historical data, combined with real-time weather data is essential for a dynamic positioning system to function properly.
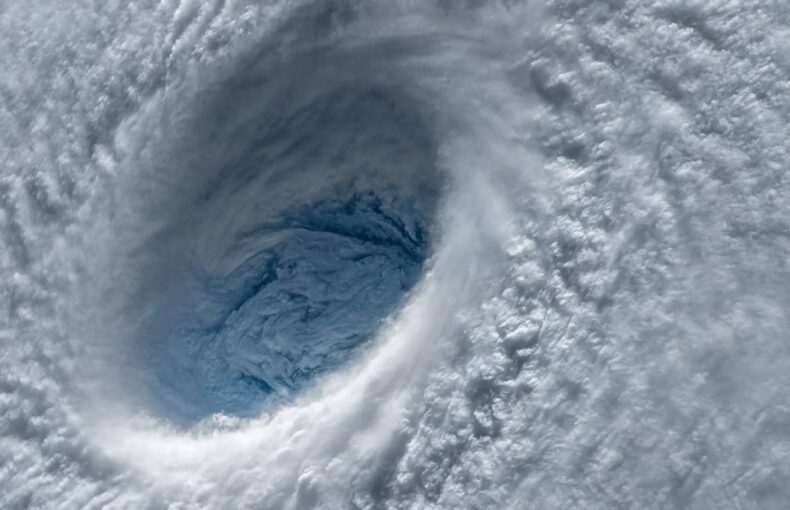
The high volume of oil rigs in Europe’s infamously rough Northern Sea is an example of one area where effective data could deliver great value. The U.S. Gulf Coast, which saw a record breaking hurricane season in 2020, is another region that could benefit from volumes of historical data.
5. Ongoing conservation efforts
Environmental change and its drivers can be tracked using historical weather data. This data helps conservation efforts working to restore ocean ecosystems by providing information about the past. Shifting environmental baselines can be established and correlated to today’s ocean conditions. These correlations help conservation efforts chart future fluctuations as they search for solutions to declining fish populations and coral reef bleaching.
6. Identifying new areas for construction projects
Historical weather data also helps marine construction developers design safer projects to prevent future ecosystem damage. For example, cable ships laying underwater cables for telecommunications or electric power transmission can benefit from using historical data when laying and removing cables. Cable ships use high pressure water to bury cable about three feet below the ocean floor. Many factors impact the functions of a cable ship, including currents, wind speed, and wave height. The speed at which the cable drops to the ocean floor needs to be carefully monitored and the speed the vessel is traveling needs to be constantly adjusted for current conditions to ensure that the cable is laid properly. Historical data provides a set of baselines that vessel operators can use to measure and test travel speeds to plan voyages and ensure better outcomes.
Artificial islands have a long history and are often constructed as an alternative to an oil platform. Constructing these islands is made easier using historical and real-time weather data. Determining wind speed and current conditions are vital to building an island to the correct height to withstand wind, wave, and current forces over time. Situating on-loading and offloading areas benefit from data analysis as well. Reinforcing an artificial island and constructing walls for protection from wind and storm conditions is also impacted by data analysis and can be determined early in the planning process.
Artificial islands are constructed using sand, soil, and other construction materials to raise land up above the water level. The land mass is usually surrounded by concrete walls for stability and houses the oil rigs, production equipment, storage tanks, and unloading terminals. Weather data is an important component used to determine location and viability of all of these needed items.
Other uses of artificial islands include storm barriers, offshore fishing bases, offshore gun foundations used for coastal protection, as well as lighthouse foundations. The use of artificial islands continues to grow and includes solid waste fills, toxic industrial activities, nuclear power plants, marinas, and airports, most notably the landfill for Kansai Airport in Osaka Bay.
Better predict the future using our historical data.
We’ve collected multiple years of historical maritime and maritime weather data to help you identify weather patterns in specific regions and fuel your AI and predictive analytics models.