Behind the interface: Meet the engineers powering Spire’s weather intelligence
Meghan Mussoline
Product Marketing Manager, Spire Weather and Climate
Explore how two Spire engineers are transforming massive satellite weather data into seamless APIs and intuitive visual tools for B2B decision-makers.
From the first click on a weather layer in Cirrus to a reliable, low-latency forecast API call, there’s a vast engineering engine behind every Spire Weather & Climate product. Spire’s backend infrastructure and visual platform are built to make complex weather data accessible, responsive, and usable.
At the heart of this engineering effort are two key innovators: Jon Beezley, who leads the architecture behind Spire’s weather APIs, and Jason Kent, the frontend developer shaping Cirrus into a powerful, intuitive data viewer. They bring deep expertise, creative problem-solving, and a passion for scalable weather intelligence to Spire’s backend and frontend systems.
Building the backbone: Jon Beezley on Spire’s APIs and data infrastructure
Jon Beezley didn’t take a conventional path into weather tech, but his journey through applied mathematics and data assimilation and wildfire modeling research has uniquely equipped him to architect Spire’s robust API infrastructure.
 With a Ph.D. in applied mathematics from the University of Colorado Denver campus, postdoc research at Meteo France in Toulouse, and a background in data assimilation and wildfire modeling, Beezley brings deep technical knowledge to Spire’s engineering team.
“I’m not a meteorologist, but I worked with WRF and statistical modeling, so I understand the data and how users expect to interact with it,” Beezley explained. “That familiarity with geospatial and weather data, in addition to my familiarity with backend architecture like APIs gave me the foundation I needed when I moved into backend engineering from academia.”
Today, as Principal Engineer, Beezely leads the design and reliability of Spire’s weather data APIs, which serve clients across sectors like maritime shipping, energy trading, logistics, and insurance.
“We support several data access patterns,” he explained. “There’s the file API, which subsets massive global forecast datasets. Then there’s the point API, which returns forecast data for a specific location. For maritime customers, we offer route-based APIs—forecasts along a moving track. And then there’s our Cirrus data viewer, which requires fast, responsive, visual access to all of this.”
Each of these requires careful architectural planning.
“With Cirrus especially, the data has to load instantly and visually. You can’t make a user download a massive grid file. So, we build access patterns that feel instantaneous while handling massive amounts of data.”
Spire processes tens of terabytes of weather data every day. But often, customers only need a single point forecast or a specific regional file.
“You can’t just load 10 terabytes into memory to return a few numbers,” Beezley, who has been at Spire for about four years, said. “So, a huge part of the job is designing efficient data delivery systems that are fast, scalable, and cost-effective.”
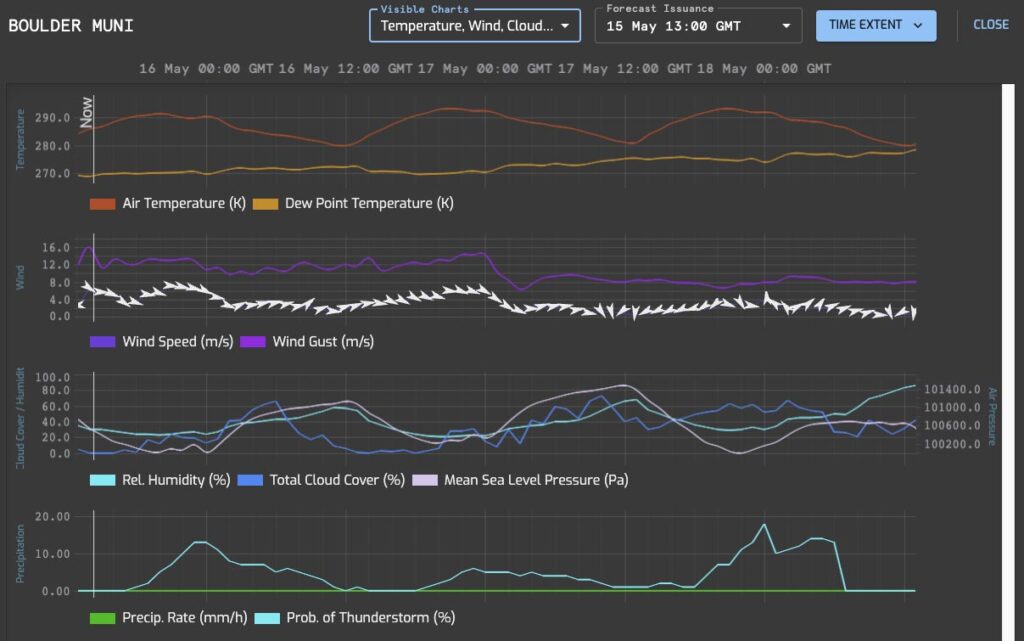
An image of a Spire Optimized Point Forecast for the Boulder Municipal Airport from May 15, 2025
Behind every decision is a delicate balancing act: minimizing latency and infrastructure cost while preserving accuracy and speed for customers who depend on real-time insights to manage risk and operations.
Designing clarity from complexity: Jason Kent on the Cirrus user experience
While Jon handles the data plumbing, Jason Kent brings Spire’s forecasts to life, designing and developing the Cirrus data visualization platform to make powerful weather intelligence accessible and intuitive as a Senior Frontend Developer.
 Like Beezely, Kent’s career journey to a frontend development at Spire wasn’t linear. He studied IT and computer science at the University of West Florida. His career began focused with web architect roles, before he pivoted toward a more programmatic and logic-based focus when he accepted a role in the Washington, DC, area as a JavaScript developer.
“My background is in web development and data visualization,” Kent explains. “Prior to coming to Spire, I worked on a tool called Worldview at NASA’s Goddard Space Flight Center, which let users browse hundreds of satellite datasets. When I found the job posting for Cirrus, it felt like the perfect match.”
Since joining Spire a couple of years ago, Kent has led the frontend development of Cirrus, focusing on efficiency, user experience, and visual clarity. Recent updates include:
- Last 10 Site Recall – Cirrus now remembers the last ten locations a user clicked, so frequent checks don’t require retyping or map searching.
- Layer State Restoration – The platform now picks up where users left off, restoring layer settings, filters, and views automatically.
- Layer Collections – Users can save and reload sets of layers and visual configurations tailored to specific workflows or weather phenomena.
- Threshold Filtering – Advanced controls allow users to highlight values within custom thresholds, improving data visibility and decision-making.
- GeoJSON Reference Layers – Users are able to overlay custom boundaries, such as service areas or points of interest, for richer context.
“Many of these changes seem small, but they save users significant time and mental load,” Kent said. “These updates make Cirrus more efficient. It’s all about letting users get what they need quickly—without reconfiguring the application.”
The most recent update with GeoJSON reference layers adds greater customizations for clients, with the ability to load in key supply chain routes, asset locations, etc.
Kent also works closely with early adopters like Dominion Energy to troubleshoot and refine features in real time.
“Jason Kent has been incredibly responsive and collaborative as we’ve worked with Spire’s Cirrus data viewer. His willingness to listen to feedback and quickly implement meaningful improvements has helped us get even more value from the platform in a short amount of time,” Jeff Mock, Lead Meteorologist at Dominion Energy, said.
What’s next for Cirrus? More dynamic data interaction. “We’re working on ways to animate and compare forecast issuances across time,” Kent explained. “The challenge is to make it intuitive, so users understand exactly what they’re seeing without needing a manual.”

A snapshot of the Spire High-Resolution Forecast on April 29, 2025, shows relative humidity values filtered to display values below 30%, sustained wind barbs filtered to show values over 15 mph, and wind gusts (color fill and values) above 15 mph, indicating areas of high fire threat.
Although they work on different ends of the stack, Beezely and Kent collaborate closely to ensure Cirrus and API systems connect cleanly.
Together, they support massive volumes of data, serve multiple industries, and create a seamless experience for users who need answers in seconds.
Coming soon: AI-driven ensemble forecasts and advanced visual interactions
One of the most anticipated updates—both from Beezley’s and Kent’s perspectives—is the integration of AI-powered probabilistic forecasts (AI-WX and AI-S2S) into Spire’s API and Cirrus suite.
“We’ve been adding the finishing touches to our AI ensemble forecast model output in our APIs,” Beezley said. “They’re going to unlock new probabilistic insights for decision-makers.”
On the frontend, Kent is preparing for what that means visually. “It’ll be just another product from a technical standpoint, but it’s an opportunity with huge potential to show uncertainty and variability in meaningful ways.”
Future enhancements in Cirrus will also include the ability to compare forecast model runs over time, animate changes, and deliver deeper insights through visual storytelling.
These updates aim to give Spire users the edge—whether they’re managing grid volatility, trading renewable energy assets, navigating ports, or optimizing assets across supply chains.
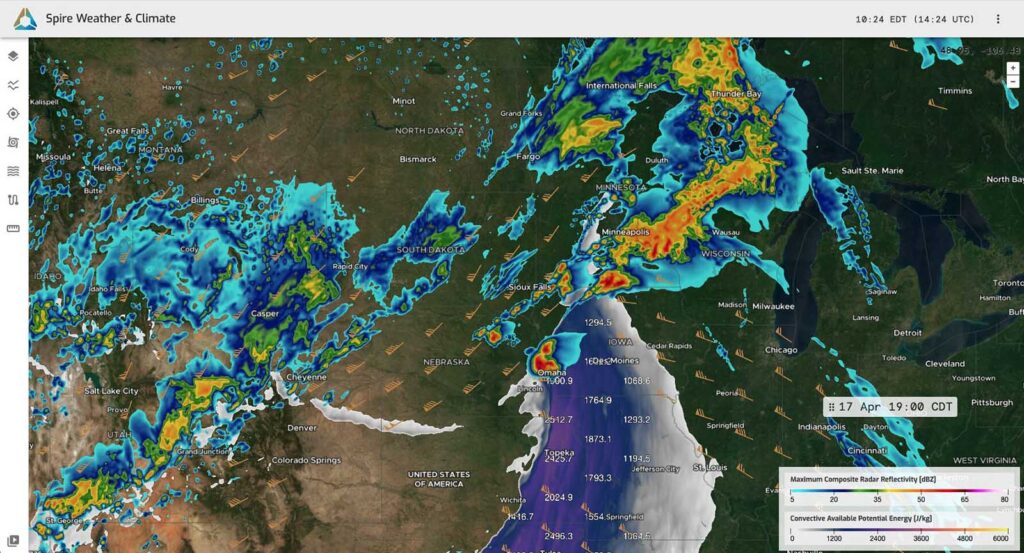
A snapshot of the Spire High-Resolution Forecast shows simulated radar, convective available potential energy (CAPE) values above 1,000 Joules/kg, and wind barbs indicating 0-6 km wind shear values above 30 m/s on April 17, 2025, amid an enhanced severe weather risk.
See what’s possible with Cirrus
Spire’s intuitive data viewer turns complex weather data into real-time answers. Ready to explore how it can work for you?