How advanced weather forecasting empowered resilience in the Atlantic hurricane season
Early, accurate forecasts reduced the impacts of Hurricanes Beryl, Helene, and Milton by helping businesses understand storm risks, allowing them to take mitigation measures and prepare for the challenges of a disruptive season.
A season of challenges
The 2024 Atlantic hurricane season demonstrated the increasing challenges posed by extreme weather. Hurricanes Beryl, Helene, and Milton unleashed high winds, flooding, and economic disruption, testing the resilience of businesses, especially in the utility and energy trading sectors. With millions impacted and billions of dollars in damages recorded, the season demanded innovative solutions to mitigate risk, sustain operations, and expedite recovery.
Spire’s High-Resolution Forecast model consistently delivered earlier, more accurate weather insights during the 2024 hurricane season, outperforming traditional forecasting tools in precision and lead time. From pinpointing landfall locations to accurately predicting rainfall and wind impacts, the model provided critical data that helped utility operators, grid managers, and energy traders make timely, informed decisions. Here’s how Spire’s forecasts proved superior during Hurricanes Beryl, Helene, and Milton.
Hurricane Beryl: Early insights, strategic advantage
Hurricane Beryl; the second named storm of the season and the earliest-ever Category 5 hurricane in the basin; proved how a tropical system can cause significant disruption. Intensifying at a historic rate over unusually warm Caribbean waters, Beryl weakened before making landfall in Texas with maximum sustained wind speeds of 80 mph and leaving a trail of economic and operational challenges.
The storm caused at least $2.5 billion in direct damages, according to Moody’s estimates, with widespread power outages affecting nearly 3 million customers in Gulf Coast states. For energy traders, Beryl’s impact resulted in a 15% spike in natural gas prices due to disruptions in supply chains and increased demand for cooling in the aftermath of power losses.
Lesser-known business impacts
Inland, Beryl’s wind field brought widespread outages and logistical hurdles for businesses unaccustomed to hurricane-force winds. Power restoration efforts were hampered by blocked roads, delaying recovery timelines and increasing costs for utility companies. Retail and service sectors in affected regions reported losses exceeding $300 million due to extended closures.
How Spire’s forecast excelled during Beryl
The Spire High-Resolution Forecast model provided early warnings about Beryl’s strength and track, giving grid operators who leverage Spire risk and forecasting data, as well as energy traders, a critical 48-hour lead time to prepare. The forecast accurately pinpointed the landfall zone within a 25-mile margin more than three days in advance and 10-20 miles within 30 hours, far exceeding the accuracy of the world’s most widely used models. Probabilistic risk metrics highlighted the highest-impact areas, enabling utility operators to pre-position crews, which could have reduced average restoration times by 20%. These insights also allowed energy traders to anticipate market volatility, mitigating financial risks during the event.
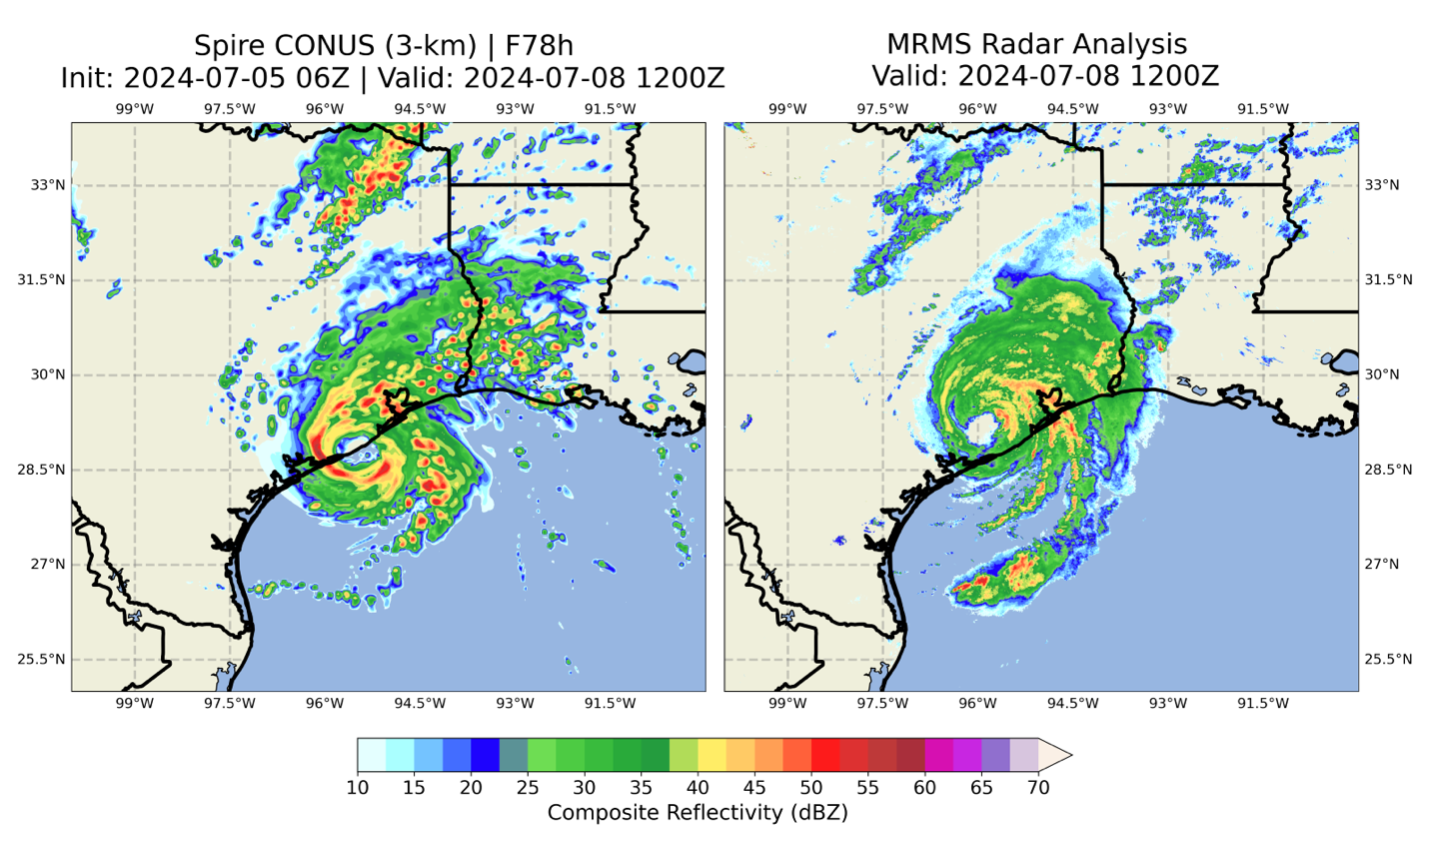
The Spire High-Resolution Forecast provided early insights into Hurricane Beryl’s track toward the Texas coastline twelve hours before other models. The image on the left shows the Spire High-Resolution Forecast position for Beryl at 12z on July 8, initialized at 06z on July 5. The image on the right shows Hurricane Beryl’s actual position at 12z July 8 as indicated by radar.
Fast facts: Hurricane Beryl’s impact
• 80 mph: Sustained winds at landfall
• $2.5 billion: Total estimated damages
• 3 million: Total power outages
• 15%: Natural gas price increase
• $300 million+: Retail & service sector losses
• 10-20 miles: Accuracy of landfall prediction within 30 hours
• 75-90 mph: Gusts near landfall, as forecasted
• 60-80 mph: Gusts predicted in Houston, verified by observations
These data points showcase the storm’s widespread economic impact and scope of damage, as well as the accuracy of Spire’s forecasting tools in providing critical lead times for business preparation.
Hurricane Helene: Flooding, wind, and the role of soil moisture
Hurricane Helene made landfall with sustained winds of 140 mph, delivering devastating impacts across Florida, Georgia, and the Carolinas. Helene’s economic toll surpassed $41 billion in direct damages in North Carolina alone, driven by prolonged power outages, flooding, and infrastructure damage. Inland areas experienced the most significant impacts, with up to 30 inches of rainfall causing catastrophic river flooding and landslides in the mountains of North Carolina and South Carolina. This led to road closures, delayed recovery operations, and increased restoration costs for utilities.
Key business impacts
For energy traders, the storm created unprecedented volatility in electricity prices as power plants were forced offline, resulting in rolling blackouts across parts of the Southeast. Electrical utilities faced $1.4 billion in repair and recovery costs, compounded by labor shortages and challenges accessing damaged areas. Soil moisture levels, already elevated from prior rain events, played a critical role in intensifying flooding impacts, underscoring the need for integrated hydrological and meteorological data in forecasting models.
Wider implications for businesses
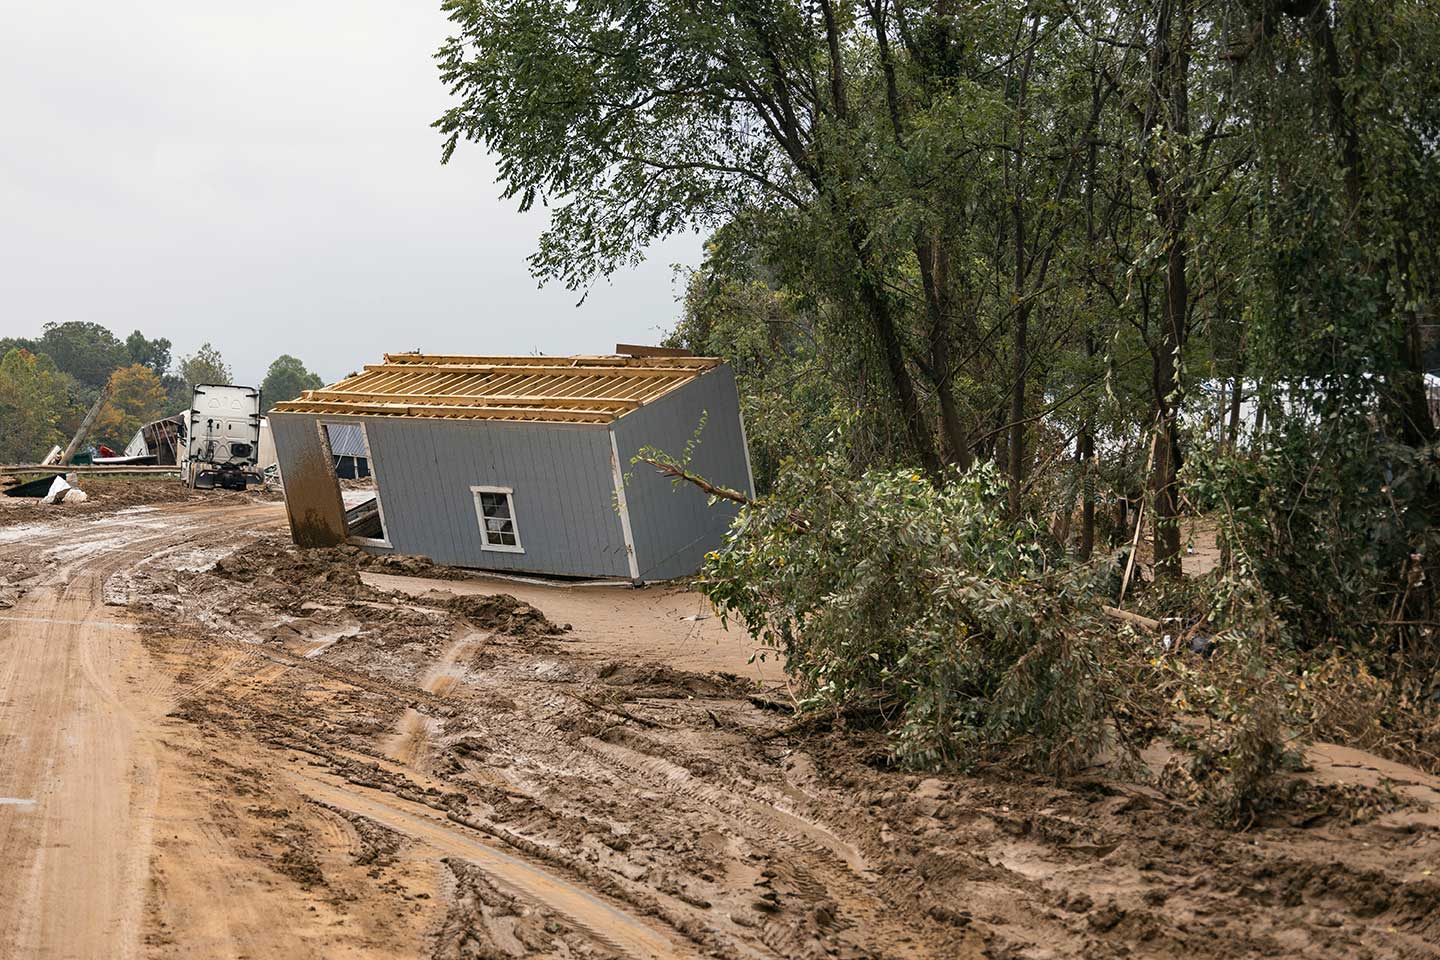
Helene’s extensive wind field downed trees and damaged energy infrastructure in areas far inland. The cascading impacts led to prolonged outages, with 265,000 customers remaining offline three days after landfall. Businesses reliant on just-in-time supply chains saw delays of 5-7 days, further impacting the regional economy.
Spire’s High-Resolution Forecast for Helene
Spire’s models provided exceptional accuracy, predicting Helene’s landfall location within a 25-mile margin days in advance and capturing the storm’s rainfall distribution with precision. By identifying areas of 20-30 inches of rainfall 36 hours ahead of other models, Spire’s forecasts enabled utilities and energy traders to plan resource allocation effectively. Paired with Spire’s Soil Moisture Insights, an enhanced understanding of flood risk made early warnings of catastrophic flooding possible. This led to a significant reduction in response times for grid repairs and improved decision-making for energy traders managing price swings.
It’s equally important to identify areas of lower impact risk to minimize unnecessary operational disruptions and maximize cost savings. Spire’s High-Resolution Forecast, for example, consistently projected that Tallahassee would avoid eye-wall core winds, which were expected to remain east of the metropolitan area. Pinpointing and communicating areas with statistically lower risk can save businesses thousands—or even millions—depending on their operational footprint.
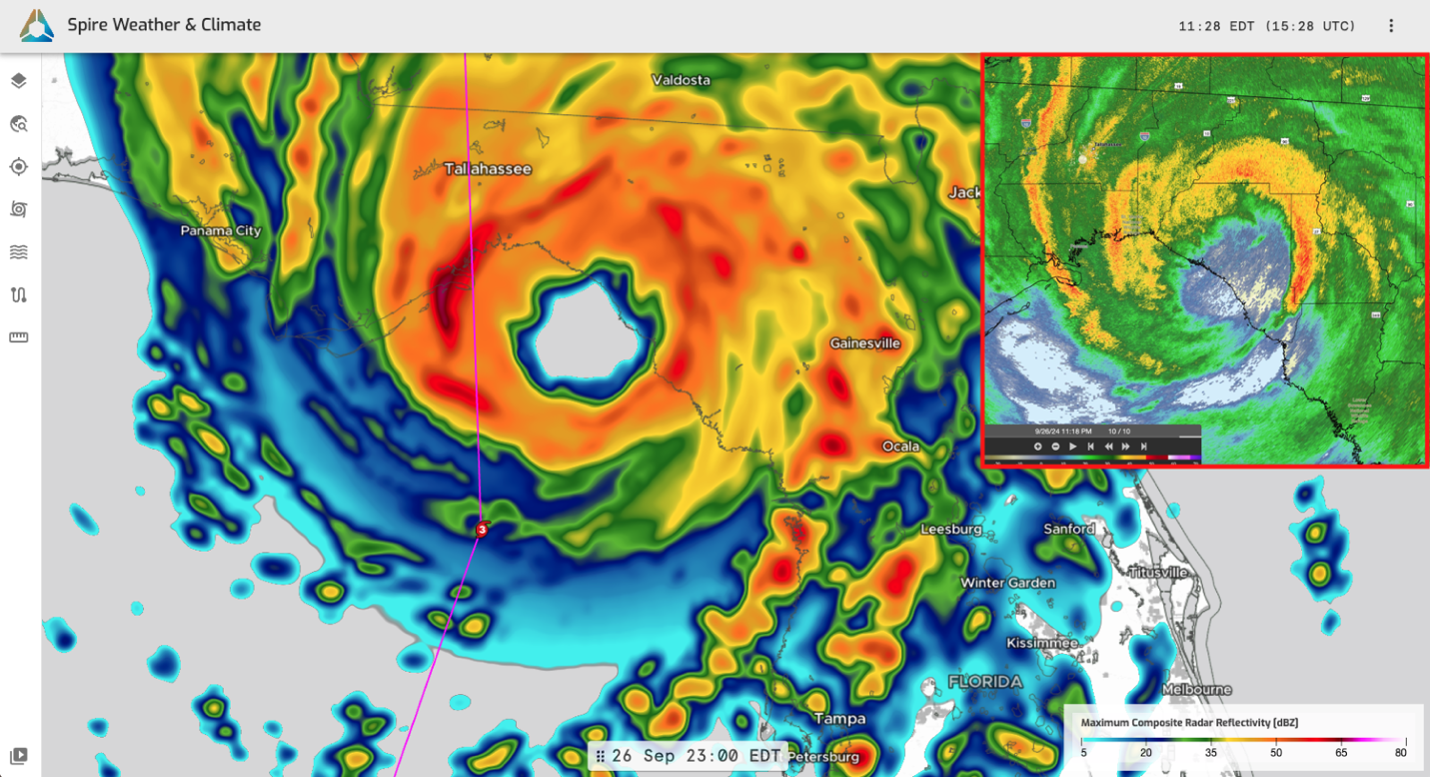
Spire’s High-Resolution Forecast model run initialized at 12z on September 26, the last official run available before landfall, depicts the composite radar reflectivity as Helene at landfall. The pink line shows the NHC official centerline track. The image in the red box in the upper-right corner shows actual radar as Helene made landfall.
Fast facts: Hurricane Helene’s impact
• 140 mph: Sustained winds at landfall
• $41 billion+: Total estimated damages in NC
• 30.78 inches: Observed maximum rainfall in NC, accurately forecasted by Spire’s forecasts
• $1.4 billion: Electrical utilities’ recovery costs
• 25 miles: Landfall prediction accuracy within 3 days
• 36 hours: Lead time of rainfall forecasts of 20-30 inches, outperforming other models
These figures highlight the storm’s devastating impacts and the remarkable precision of Spire’s advanced weather forecasting in aiding business preparation and response efforts.
Hurricane Milton: Complex impacts, historic records
Hurricane Milton caused widespread destruction, making landfall near Siesta Key, Florida, as a Category 3 hurricane with sustained winds of 120 mph. The storm’s impacts were multifaceted, with storm surge, rainfall, damaging winds, and a prolific tornado outbreak creating widespread disruption. Milton’s economic toll is estimated between $20-$100 billion, with insured losses accounting for the majority of costs. Inland rainfall totals reached over 20 inches in some areas, causing flash flooding and major disruptions to transportation and energy infrastructure.
Key business impacts
Power outages during Hurricane Milton peaked at nearly 3.5 million customers across Florida. Adding to the devastation, a historic tornado outbreak produced 46 confirmed tornadoes, including three rated EF3, which inflicted severe damage on infrastructure and industrial facilities. However, Tampa Bay experienced a rare reverse storm surge, with offshore winds temporarily lowering water levels, ultimately saving an estimated $500 million in potential damages in the region’s most vulnerable areas.

Underreported impacts
The storm’s extensive rain bands caused logistical bottlenecks for supply chains reliant on Florida’s major ports. Major industrial hubs reported a 20-30% drop in operational efficiency for weeks after the storm, exacerbating economic losses.
Spire’s forecasting excellence during Milton
Spire’s High-Resolution Forecast model accurately predicted Milton’s landfall location within 30 miles in 67% of model runs — all accurately south of Tampa Bay, outperforming traditional forecasting tools. Spire’s rainfall forecasts were equally accurate, matching observed totals within a 1-2-inch margin in high-impact areas. The insights enabled utilities to deploy repair crews effectively, reducing power restoration times by up to 20%, and helped energy traders stabilize pricing through early awareness of storm impacts.
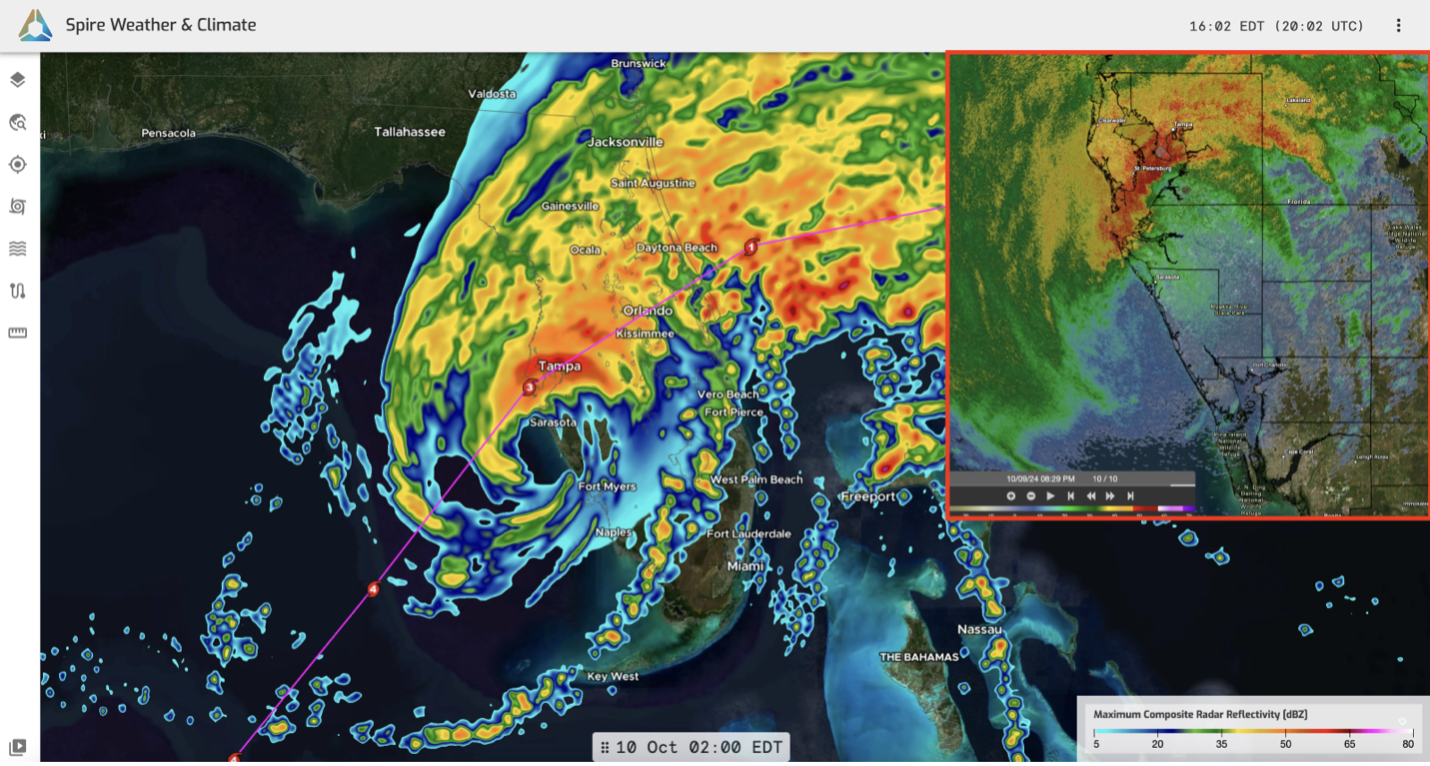
Spire’s High-Resolution Forecast model run initialized at 12z on October 7, days ahead of Milton, depicted the composite radar reflectivity at Milton’s landfall. The pink line shows the NHC official centerline track at the time. The image in the red box in the upper-right corner shows actual radar as Milton made landfall.
Fast facts: Hurricane Milton’s impacts
• 120 mph: Sustained winds at landfall
• $20-$100 billion: Estimated total economic toll
• 3.5 million: Customers affected by power outages
• $500 million: Potential damages saved due to a reverse storm surge in Tampa Bay
• 126: Tornado warnings issued, the most ever recorded in a single day in FL
• 30 miles: Landfall location prediction accuracy within 3 days
• 90th percentile: Rain forecasts (in 90th percentile of QPF* distribution of models) closely matched observed totals in high-impact areas
*QPF stands for Quantitative Precipitation Forecast
These statistics summarize the storm’s significant impact and Spire’s advancements in forecasting that helped mitigate potential damages.
The Spire advantage
The 2024 Atlantic hurricane season underscored the increasing frequency and complexity of extreme weather events. For utility operators, grid managers, and energy traders, resilience depended on timely, accurate weather insights. Spire’s High-Resolution Forecasts provided a critical advantage, enabling stakeholders to mitigate risks, optimize resource deployment, and adapt to rapidly evolving conditions.
As weather risks continue to challenge businesses, Spire Weather & Climate remains committed to delivering clarity through chaos. With our space-powered weather intelligence, we empower industries to anticipate, adapt, and thrive in the face of uncertainty.
 Written by