Look beyond the color spectrum to see powerful Earth data
Sensing radiation outside the visible spectrum reveals valuable information about our planet.
There is a universe of information all around us that we can not see. It is everywhere. It bounces off of us and passes through us. And it is packed with insights about our planet. It is the world outside of the visible light.
The light we see is a part of a broad electromagnetic spectrum. It stretches from gamma rays, with wavelengths shorter than the width of a helium atom, to radio waves, which can have wavelengths longer than the Earth’s diameter. The visible portion of the spectrum is incredibly narrow, extending from 400 to 750 nanometers—to put that into context, a human hair is about 100,000 nanometers wide. While our eyes are highly attuned to this band, we are blind to all other electromagnetic waves. Where humans fail, technology can help.

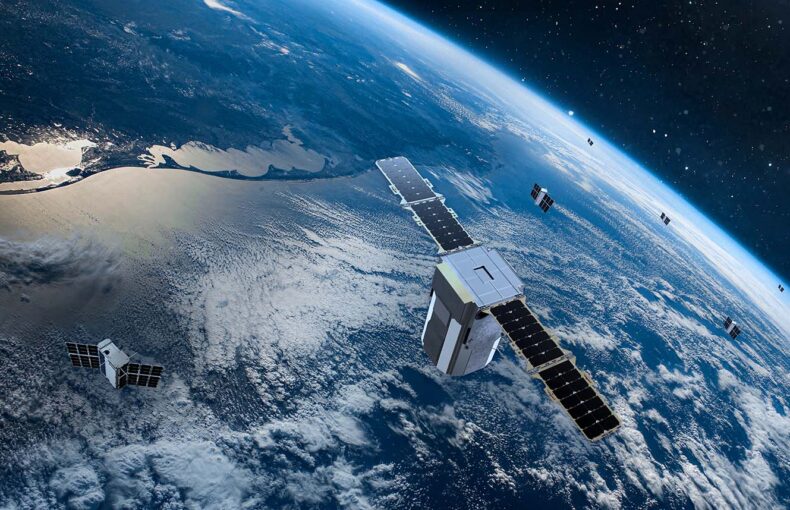
An illustration of one of Spire’s nanosatellites orbiting the Earth.
Scientists have long used devices sensitive to radiation outside the visible spectrum to better understand our world. For example, doctors use X-ray sensors to peer inside our bodies. In the same way, electromagnetic radiation that is longer than visible light reveals invaluable insights about the Earth.
Infrared, microwaves and radio waves are not commonly known as tools for studying the planet. Microwaves are most famous for reheating leftovers. And we tend to associate radio waves with music and communication signals. But these types of radiation reflect, scatter, and bend as they travel through the atmosphere and collide with the Earth. Monitoring these interactions produces rich information and pinpoints phenomena that we would struggle to study with our naked eyes. And the wide range of wavelengths of radiation outside the visible spectrum provides vast potential for data collection.
For example, satellite-based sensors that monitor infrared and microwave radiation can help build data-rich profiles of clouds and gases like water vapor, explained Steve Albers, Spire Global’s lead scientist for global cloud analysis. Experts can perceive a cloud’s altitude by measuring the frequency of infrared radiation it emits. This is possible because the amount and wavelength of infrared radiation correlate to temperature, and objects tend to be colder the higher they are in the atmosphere.
Sensing in infrared can also help determine cloud composition, as clouds heavy with liquid particles emit different amounts of specific infrared wavelengths than clouds full of ice particles. But the infrared band can not help pinpoint precipitating clouds. The size of these clouds’ water droplets interferes with electromagnetic radiation at infrared wavelengths. So experts like Albers tune their sensors to microwaves, which have long enough wavelengths to escape the clouds and reach the devices.
When combined, the altitude and composition data can help build a detailed 3D map of cloud coverage that meteorologists can leverage in forecasting. Cloud conditions are also helpful when calculating the amount of solar radiation reaching the ground, which plays a vital role in the renewable energy and agricultural industries.
Spire’s advanced cloud analytics enable the prediction of total cloud cover percentage anywhere in the world, as illustrated in this video. The measurement is useful for a range of applications, including improved solar radiation prediction for renewable energy forecasting.
Spire collects weather data and creates solutions to solve challenges across industries.
As experts tune into radiation with longer wavelengths, it is almost as if the clouds become transparent, explained Dallas Masters, Earth observations director at Spire. His team reveals insights about our planet by studying the Global Navigation Satellite System signals beaming across our atmosphere. The GNSS signals’ long wavelengths allow them to pass through clouds, fog, crops and even penetrate the soil. And since they are emitted from numerous orbiting GNSS satellites, they are available to study everywhere, day and night.
“They are all-weather signals,” he said. And their unique interactions with our planet have several practical applications.
For example, the signals bend as they travel through different temperature layers of our atmosphere, just as visible light appears to ripple over a hot highway. The degree that each signal refracts depends on the temperature and density of the air it passes through. As a result, scientists can study a signal’s journey to measure atmospheric temperature, pressure, and humidity.
This measurement is called radio occultation, and it helps create a detailed profile of conditions that extend from the Earth’s surface into the stratosphere. Spire Global makes about 10,000 of these measurements a day, feeding a dataset that helps improve the accuracy of weather forecasts.

Learn more about radio occultation and how the atmospheric data collected from these measurements helps boost weather forecast accuracy.
Using the same GNSS signals, scientists can also estimate ocean surface conditions. Rough seas scatter the signals more than calm water. So experts can be confident that seas are turbulent when Spire satellites receive signals that weaken after they reflect off the ocean. To put it another way, the satellite’s observations translate into roughness, just as our brains convert visible light bouncing off the sea into shades of blue and green.
Arctic scientists use a similar technique to map sea ice. And when experts conduct this reflectometry process over land, they can measure soil moisture. The signals pass through vegetation, penetrate the earth, and reflect off the water trapped in the ground. Since wet soil reflects more energy than dry soil, the signals’ strength translates into moisture data. And the penetration depth of the reading correlates with the wavelength of the signal used.
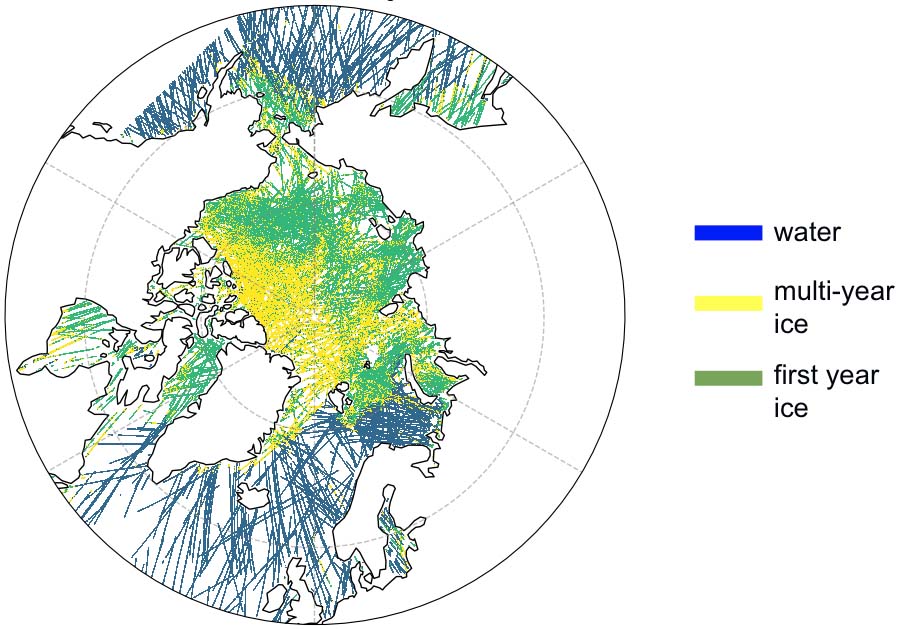
This chart shows sea ice classifications in the Arctic. Spire created it from data collected by grazing angle GNSS-R measurements made in March 2020, gridded at 5-kilometer resolution.
Practically, this means farmers and conservationists can scan large tracts of land and locate areas with too much or too little moisture. And they can make these observations on overcast days and cloudy nights, alike.
The list of applications goes on. There are other bands of infrared and microwave radiation at wavelengths perfectly suited for studying specific environmental conditions. They help experts monitor water vapor and dust density at different altitudes, ozone information, cloud top and sea surface temperature, and carbon dioxide levels, said Albers.
“This just scratches the surface,” he said.
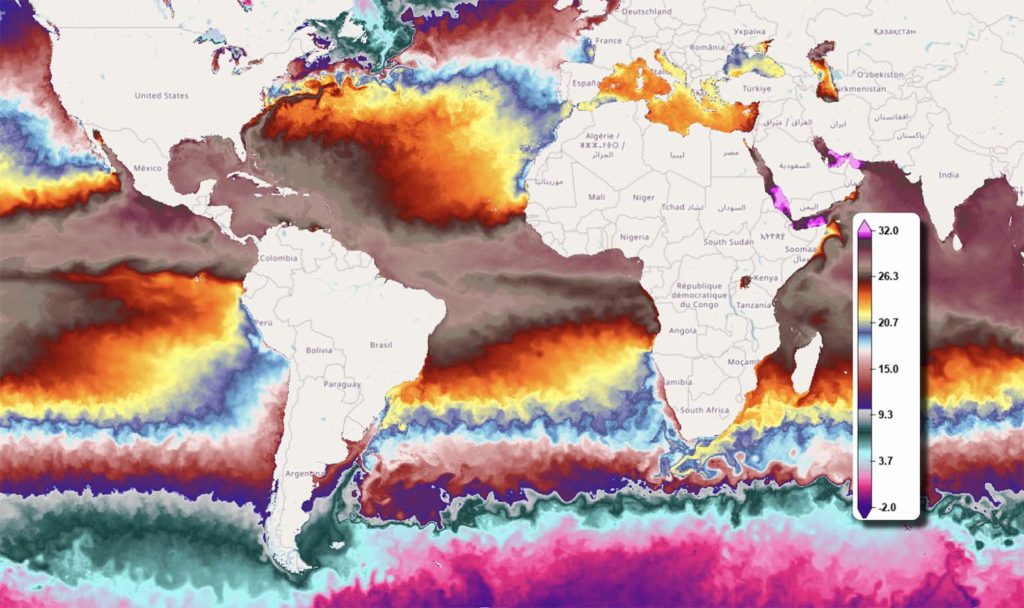
This chart, created with Spire Global’s data, illustrates sea surface temperature in degrees celsius.
The versatility of GNSS signals and infrared—just portions of the entire electromagnetic spectrum—illustrates the vast potential of studying the world outside the visible spectrum. And not just in atmospheric sciences. Experts in fields as diverse as medicine, volcanology, and archeology leverage the unique characteristics of different radiation bands to collect valuable data. There are enormous opportunities in the world beyond the visible spectrum. The more we monitor this invisible universe, the better we can see where our planet is heading.
Spire looks beyond the color spectrum to collect impactful data about our planet.