Airline cost savings with space-based flight data: Skailark’s innovative cost platform for airlines
 Written by
Tjasa Pele
Digital Marketing Specialist
The use of space-based data has transformed the way businesses operate across different industries by providing them with valuable insights to make informed decisions.
One area where space-based ADS-B data has had a significant impact is in airline economics or cost benchmarks for competitors. Discover how Spire Aviation’s global flight and aviation insights empowers Skailark, an aviation intelligence and B2B data-as-a-service provider, to model bottom-up airline cost intelligence that offer in-depth insights to their customers. Skailark is dedicated to providing easily accessible highly granular and holistic data for aviation professionals involved in finance, network planning, strategy, and consulting.
Learn more about space-based flight data and aviation analytics
Unprecedented granularity in airline cost intelligence with space-based flight data
Having granular and holistic data on airline costs is crucial for airlines as it helps them to easily identify areas where they can reduce costs and improve efficiency. This can include everything from fuel consumption and maintenance expenses to fleet planning and route optimization. Accurate and detailed data also helps airlines to benchmark their performance against their competitors to stay ahead of the curve and ensure long-term profitability.
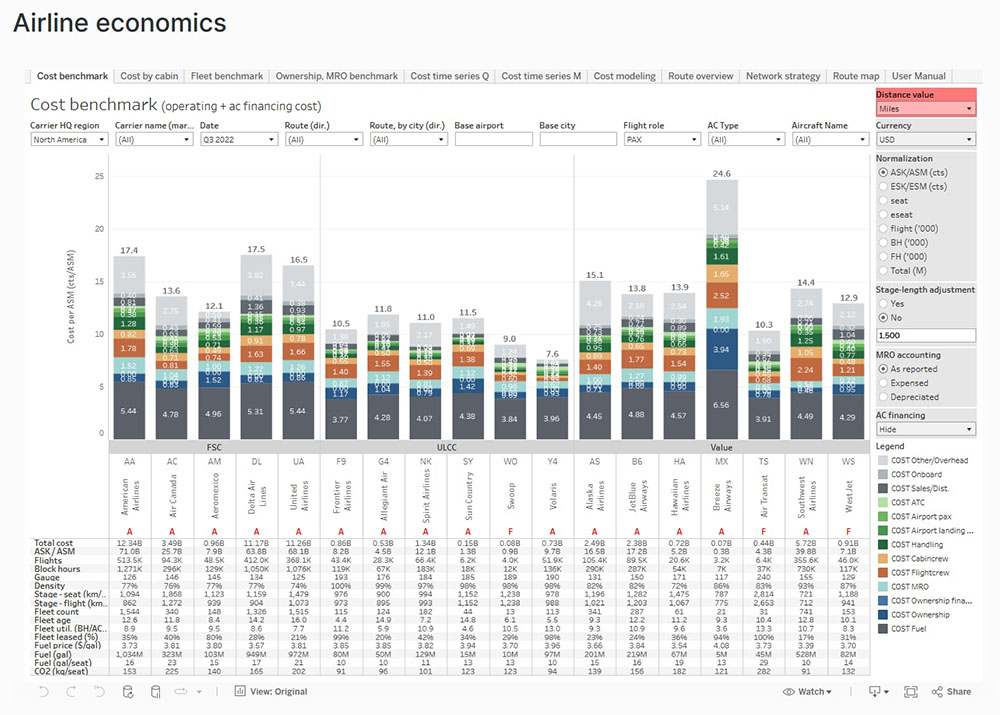
Skailark cost benchmark dashboard example
With its innovative bottom-up approach and use of only non-proprietary data, Skailark is able to deliver a never seen level of data granularity and standardization to compare carriers worldwide. Their airline economics product provides a data image of the global aviation industry, focusing on the individual airline cost items covering all flights of over 200 airlines.
The importance of space-based flight data for accurate airline cost analysis
In order to create their comprehensive bottom-up models Skailark needed accurate historic flight data to better understand which flights actually took place, meaning they could not rely on scheduled flight data. They opted for Spire aviation’s space-based approach, as opposed to the conventional ground-based alternative due to its enhanced coverage worldwide. “This is a super important feature as the oceans cover two-thirds of the earth’s surface and therefore play a huge role,” highlighted Dr. Christian Soyk, founder of Skailark. Another reason for using space-based ADS-B data was the ability to map actual aircraft based on registration information.
“We are highly impressed by Spire’s space-based approach as well as the hands-on pragmatic approach of the whole team to deliver amazing results. We were looking for the most accurate flight data and also a partner with a great collaborative mindset which is important in building amazing products together.”
Share on Facebook Share on Twitter Share on LinkedIn
Skailark’s innovative cost platform for airlines
The web-based platform developed by Skailark allows airlines to benchmark themselves against competitors and dynamically model scenarios based on the strategic questions and business challenges they currently face. The airlines are able to make better-informed business decisions by discovering value potentials and deriving actions for a variety of different business scenarios and challenges.
In the North American market alone there’s an estimated value potential of $600-800 million of achievable savings for carriers flying narrow-body aircraft alone. The cost outputs available in their solution range from CASK/CASM to block hours, flight hours, seats, e-seats, and many more options.
To access different variables, users can utilize visual dashboards available within the platform.
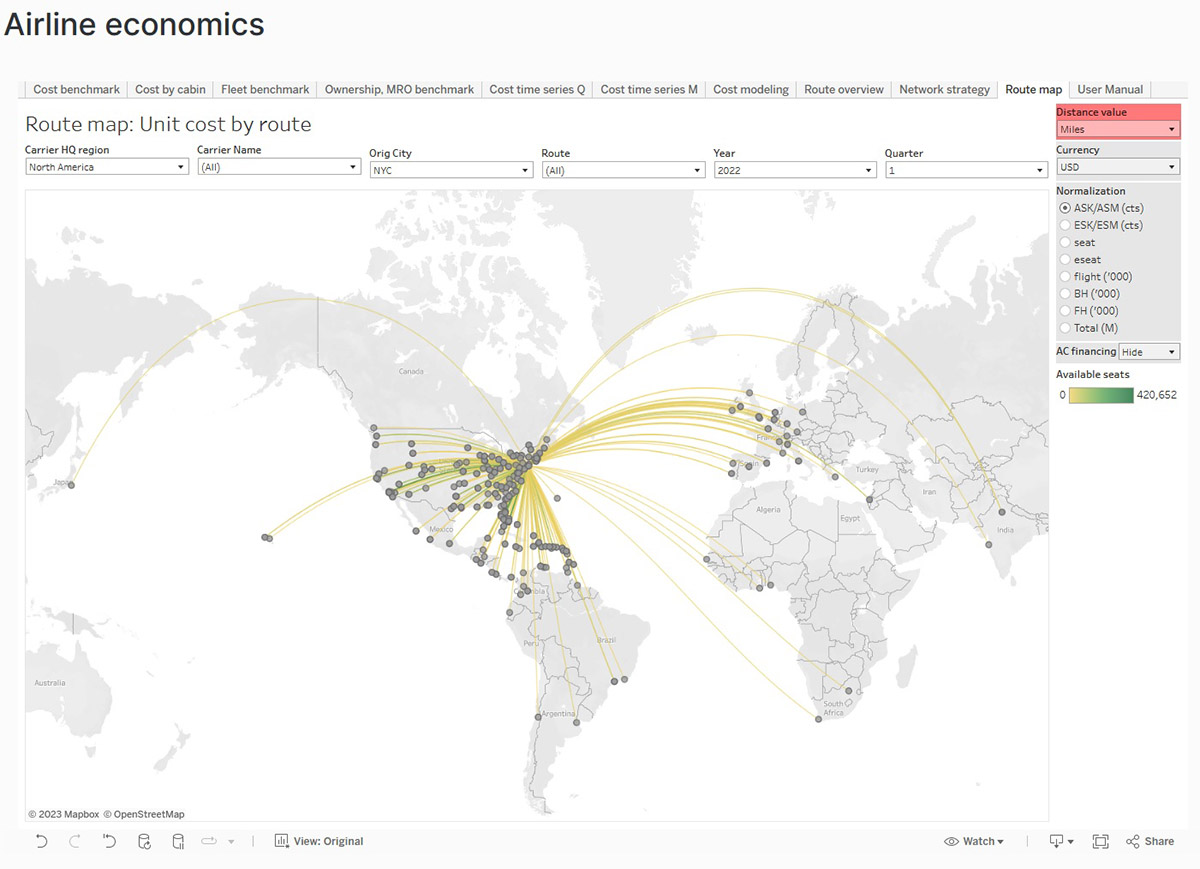
Skailark route map dashboard example
The Road Map Dashboard (pictured above) visualizes different routes for every airline. This can be done based on one departure airport, in this example New York City, or for all airports the carrier departs from. For the specific route, the dashboard shows the different aircraft types, as well as the associated cost per available seat mile (CASM), for the airline and its competitors on that route.
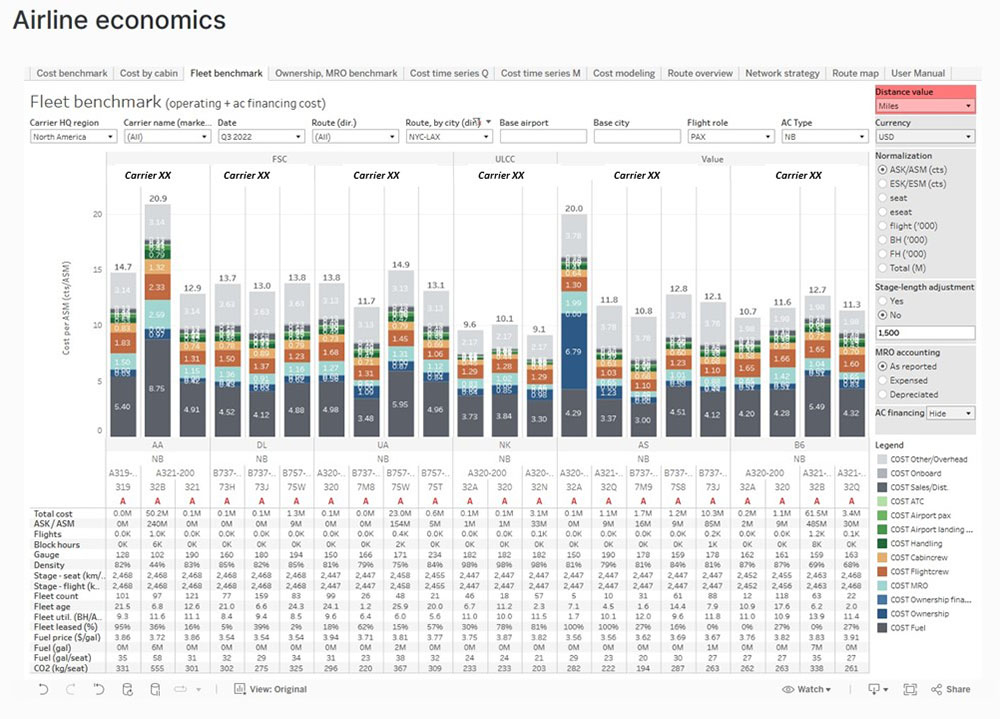
Skailark fleet benchmark North America hidden carrier names
And the Fleet Benchmark Dashboard enables airlines to understand how their fleet costs compare to those of their competitors. As with all dashboards in the software, everything is highly adaptable through the power of bottom-up modeling. This allows a user to have a holistic overview of the fleet landscape or deep dive into concrete scenarios like comparing a specific aircraft type for a particular route.
Modelling airline economics with space-based flight data
With its use of non-proprietary data and the outside-in perspective for every airline available in the Skailark platform, the airlines can reduce their data preparation and analysis costs enormously associated with big data processing for strategic decisions. Their airline economics product allows all users in an organization to easily access ready-to-use flight data right at their fingertips without the need for extensive skills.
By using Spire Aviation’s global flight data in format of Flight Report, Skailark is pioneering the way in delivering a never seen level of data granularity and actionable insights across carriers worldwide, helping them reduce expenses and improve their operations. This will allow the airline industry to become more sustainable, both economically as well as environmentally.