Charting the skies: A comparative analysis of China and USA flight volume, fleet development and market value
- Introduction
- Monthly trends in air traffic volume and route landscape
- Analysing the shifting air travel map in the US and China
- Exploring the commercial passenger fleets development in the US and China
- Analysing the market value of US and China fleets
- Uncovering the usage and level of technology
- China fleet technology & utilisation
- US fleet technology & utilisation
- US spotlight: Southwest Airlines
- China spotlight: Hainan Airlines
- Findings & Conclusions
 Written by
Tjasa Pele
Digital Marketing Specialist
In an ever-changing landscape of China and U.S. aviation industries, driven by shifting passenger needs, trade dynamics, and global connectivity, we delve into a comparative analysis of their trends.
Introduction
AviationValues and Spire Aviation have collaborated and combined our extensive datasets to provide an in-depth analysis on the United States and China aviation markets. Paying special attention to dynamic developments within their fleets, ever-shifting contours of air travel routes, journeys utilisation, values and general trends we’ve seen over the past year. As the two “Flying Giants” are in a constant state of flux, adapting to the evolving demands of passengers, trade, and global connectivity, Kane Ray and Tjaša Pele compare and contrast trends between them. By examining these aspects within the fleets of the US and China, we gain a profound insight into the two aviation powerhouses that shape global travel.
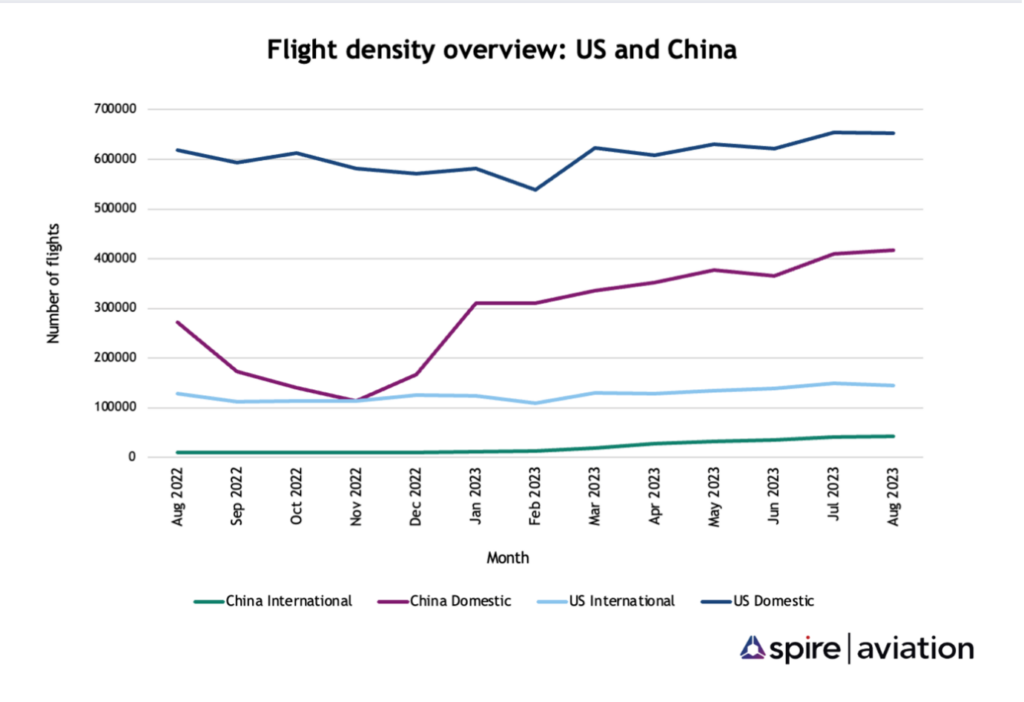
Flight patterns unveiled: Monthly trends in air traffic volume and route landscape
Chinese international flight activity only began to regain momentum earlier this year, following the final relaxation of stringent Covid-19 measures. Prior to January 2023, the country maintained a consistent inflow, averaging over 10,300 flights per month. Since the reopening of its borders to international travellers, China has been witnessing a steady monthly upsurge in tourist arrivals, culminating in the highest count of flights (over 41,000) recorded in July 2023. This signifies a fourfold increase in flight volume compared to the same month in the previous year. In contrast, the United States has maintained stable international flight density over the past year, with an average of over 121,100 flights per month, as the market had already rebounded from health-related restrictions. Notably, during the peak of summer holidays in July 2023, both the US and China experienced their highest influx of travellers in the last year and a half.
A more distinct scenario arises when contrasting China and US domestic flight operations. US flight volumes remained relatively stable around 595,600 flights per month, surpassing 600,000 flights per month by March 2023. Conversely, China’s domestic flight sector faced a slower initial recovery, influenced by varying travel measures that impacted domestic flight density. The data clearly shows instances of heightened restrictions leading to flight reductions twice in the past year. After the complete removal of all travel obstacles, domestic flight density increased by 53%.
Route revisions: Analysing the shifting air travel map in the US and China
With the constantly growing increase in the air traffic and passenger demand for more connectivity, we investigated how this dynamic has influenced the route landscape of the US and China. Based on our analysis, both markets have focused on reestablishing or strengthening domestic and regional connections.
Flight routes added in August 2023 in China
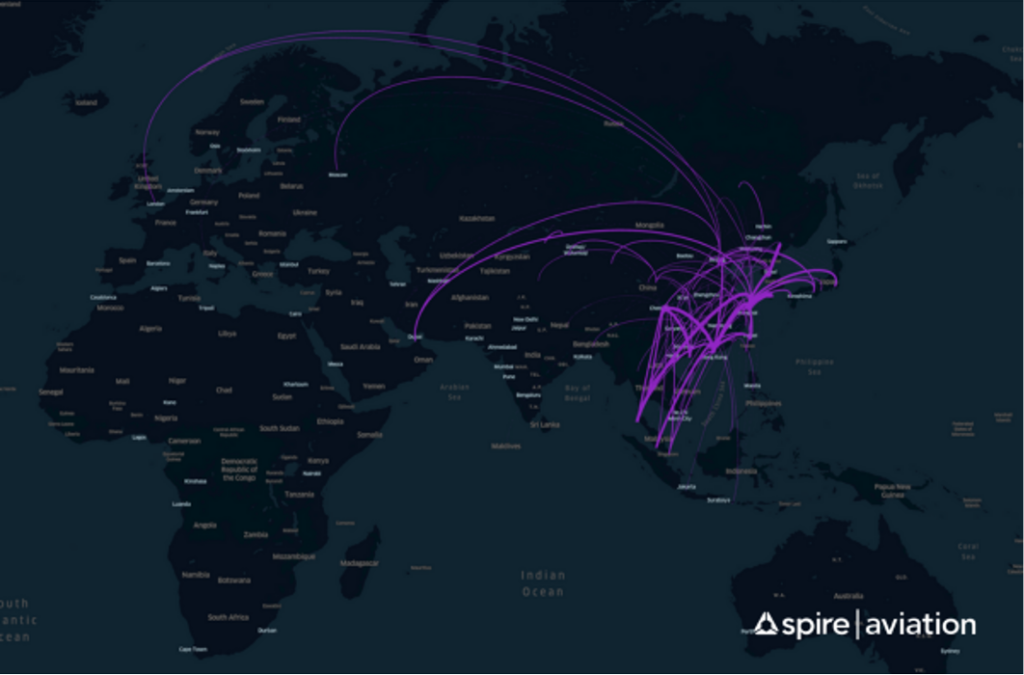
Bearing in mind that China only started to reopen to international travellers beginning of 2023, it comes as no surprise that the majority of new routes added are domestic (Shanghai, Macau, Hong Kong and Chengdu) or regional ones (Thailand, Malaysia, Singapore, South Korea and Japan). Internationally, connections to Dubai, Moscow, and London were reestablished, while flight routes with substantial service before the pandemic (Paris, Toronto, Tel Aviv, Chicago) are yet to be fully restored.
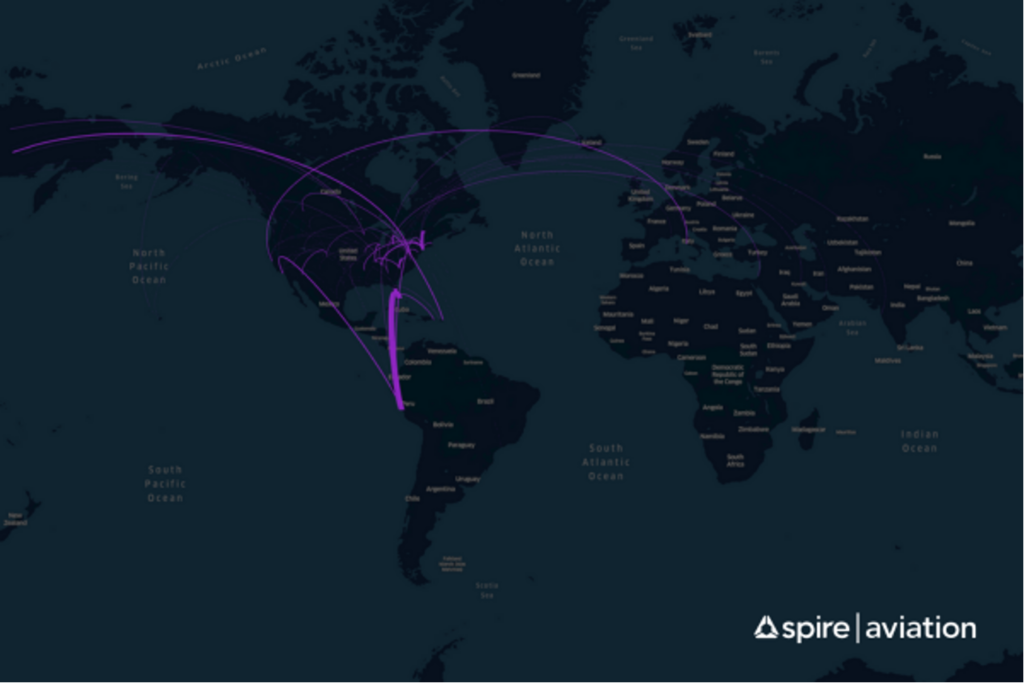
The priority given to domestic and regional strengthening was a feature for the US as well, with domestic service growth out of cities such as Denver, New York, Los Angeles and Dallas-Fort Worth; and regional services to Montreal, Puerto Rico and the Dominican Republic. Longer haul connections were also reestablished from US hubs to Italy, Japan and Peru. In August 2023 some international routes were also , for example from different American cities to Lima, Mexico and Shanghai.
Flight routes added in August 2023 in the US
Wings of Influence: Exploring the Commercial Passenger Fleets Development in the US and China
This comparative analysis delves into the yearlong overview of the world’s two largest economies’ fleets, examining them based on two key parameters: number of flights and fleet size. By assessing these metrics, we uncover the underlying factors that contribute to their prominence. Let’s start by looking into the US and China flight density from August 2022 to August 2023.
Based on Number of Flights
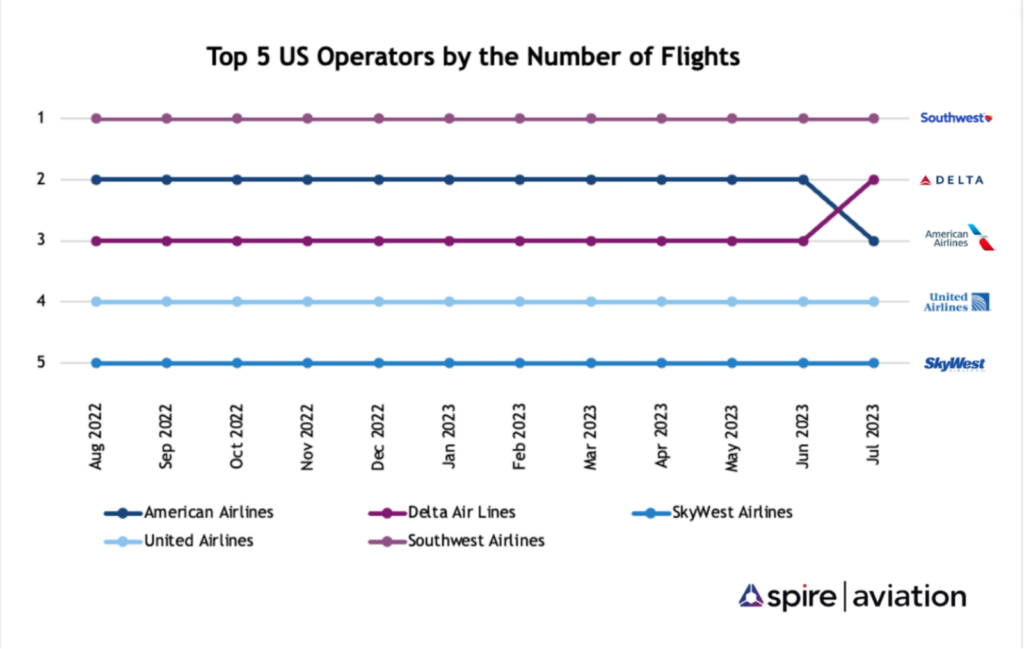
US Flights
During the analysed year, Southwest Airlines stood out among the leading commercial passenger fleets. With an average of 112,100 flights per month, the airline maintained its position as the most active commercial airline. Following closely in second place was American Airlines, operating over 90,960 flights per month. Delta Air Lines secured the third position with an average of 87,100 flights per month.
In the initial half of 2022, SkyWest Airlines and United Airlines vied for the fourth and fifth rankings, maintaining average monthly flight counts ranging from 53,000 to 67,000. Transitioning to the latter half of 2022 and extending throughout 2023, United Airlines secured the fourth spot by augmenting its flight count to over 70,000, while SkyWest Airlines consistently maintained its average of 57,000 flights per month.
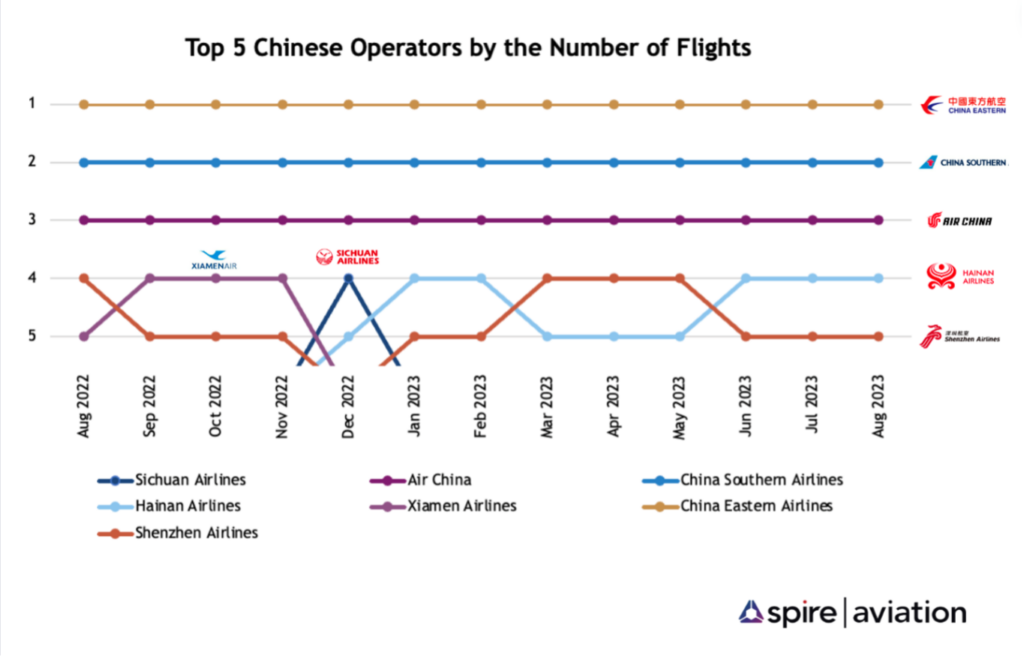
China Flights
The Chinese air transport market witnessed more significant changes. The ranking of the top three Chinese carriers was in a state of flux during the initial half of 2022, but has since stabilised, with China Eastern securing its position by operating nearly 755,000 flights over an eighteen-month period. In second place, China Southern operated 643,000 flights, followed by Air China with 499,000 flights during the same period. The remaining two slots within the top 5 experienced considerable changes. Throughout the majority of 2022, Xiamen Airlines and Sichuan Airlines managed to hold their positions, but in 2023, they were overtaken by Hainan Airlines and Azur Air.
Based on Fleet Development
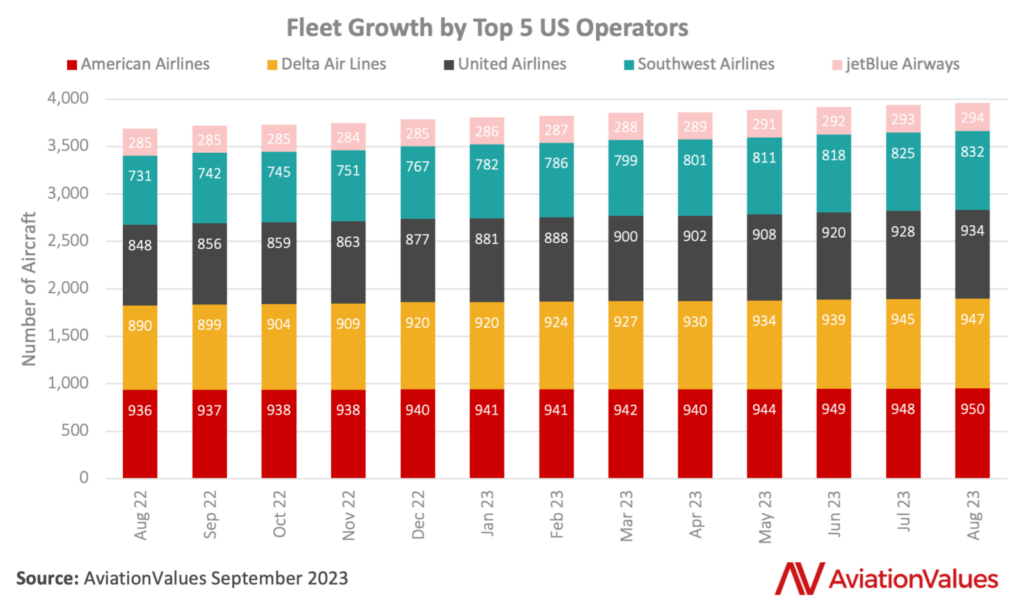
For the 12 months ending 31 August 2023, AviationValues has detailed fleet growth for all the Top 5 US operators. The leading airline by increase in fleet size was Southwest Airlines. Its fleet has grown by 101 aircraft within the timeframe. As will be investigated further on, its Boeing 737 MAX 8 fleet has increased by 110 aircraft, taking them from 92 to 202 MAX 8 aircraft by August 2023.
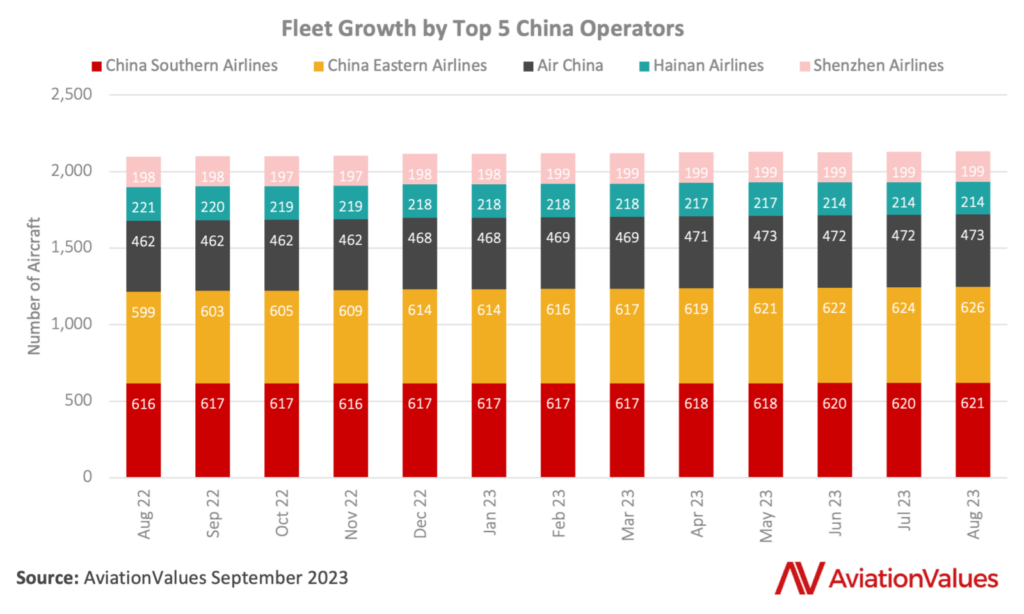
Within China we have seen a more modest fleet growth for the 5 top operators. Unlike the US and other nations, China took a cautious approach in the post Covid-19 environment, and this had a knock on effect to the full continuation of both regional and international air travel.
Geopolitics is a consideration here: imports of US manufactured aircraft have stopped. Most notably, the Boeing 737 MAX given the existing backlog with Chinese operators. Aside from Boeing aircraft, China Eastern Airlines has led the way with the addition of 27 aircraft in the period. In contrast, we have seen Hainan reduce the fleet size by seven aircraft as it aims to stabilise following ownership restructuring.
Fleet growth for the 12 months ending 31 August 2023 for the US and China is depicted below.
Sky economics: Analysing the market value of US and China fleets
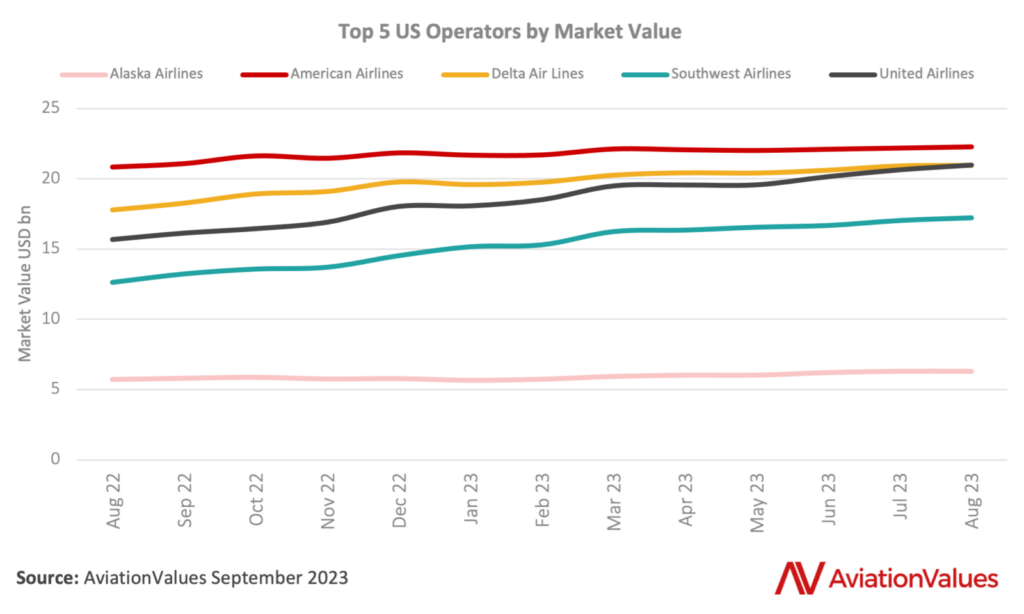
Considering the chart below which depicts the Top 5 US Operators by Market Value for the 12 month period ending 31 August 2023, United Airlines is clearly the biggest mover, due to an influx of Boeing 737 MAX 8 and MAX 9 aircraft. United’s Widebody additions are limited to the Boeing 787-10, but combined with MAX additions, more than outweigh new delivery volumes at other US Majors, American Airlines and Delta Air Lines. During the 12 months, United also parted with numerous 737-700, A319ceo, and A320ceo aircraft.
Like Southwest Airlines, Alaska Airlines is a Narrowbody only operator, but it is categorised as a full service carrier. It is one of ten current and future Boeing 737 MAX 9 operators (along with United), it has received this aircraft variant exclusively during our analysis period as Boeing worked through the idle MAX backlog following the MAX grounding, Covid-19, and aircraft rework.
As of 30 September 2023, Alaska Airlines is an all Boeing operator, having exited its last of ten previously operated A321neos. Other significant fleet exits during the period were Airbus A320ceo and A321ceo aircraft. In coming years, the total fleet Market Value should continue to grow with the arrival of both the 737 MAX 8 and 737 MAX 10 to its fleet. It could be expected that its oldest 737NG in fleet, namely 737-700s and 737-900s, will be the first aircraft replaced, although no retirement strategy has been announced. Alaska Airlines places fifth in US operator total fleet Market Values.
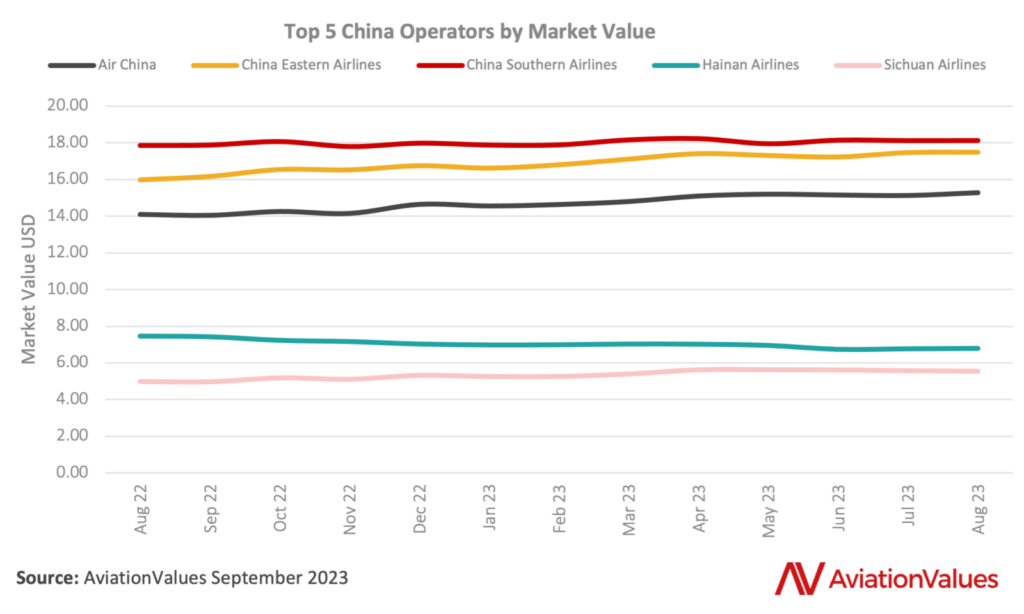
Across the Pacific, the total Market Value of China Eastern Airlines’ and China Southern Airlines’ fleets has converged for the 12 months ending 31 August 2023. The gap has narrowed due to more new delivery aircraft entering China Eastern Airlines’ fleet during the period. There have been few fleet exits, including Boeing 737NG and Airbus A320ceo Family aircraft, from both airlines. China Eastern Airlines has made significant additions to its A320neo and A350-900 fleet in 12 month period whereas China Southern Airlines has added A320neo, A321neo and A350-900 types from Airbus.
Air China has also had a marked fleet Market Value rise due to the delivery of nine new A350-900s. Another followed in September. Air China exited some 737-800, A320ceo and A330-300. The following chart shows the Top 5 Chinese operators by total Market Value for the 12 month period.
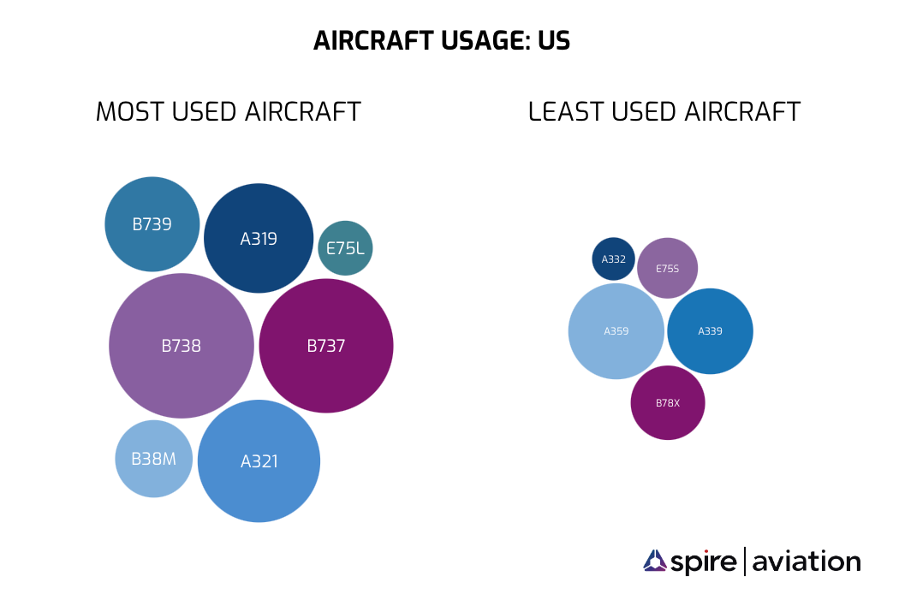
Uncovering the usage and level of technology
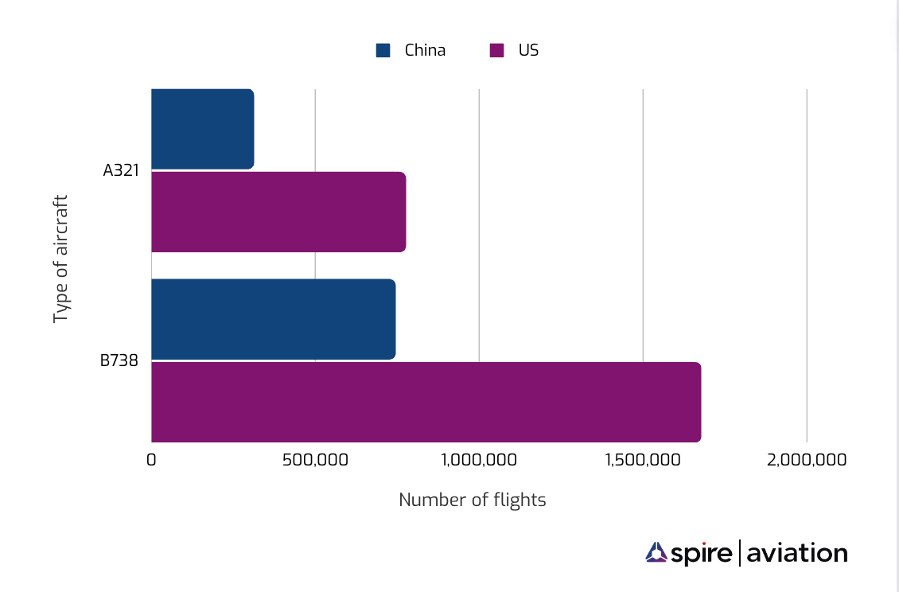
Our analysis shows that both countries’ fleets centre on two main types of aircraft, all Narrowbodies. As seen in the chart below: the Boeing 737-800 is the most popular aircraft in both markets, primarily used for short to medium-range passenger flights. Not surprisingly, its direct competitor the Airbus A321 is also balanced between both countries. These two aircraft are the only two used by both “Flying Giants”.
China fleet technology & utilisation
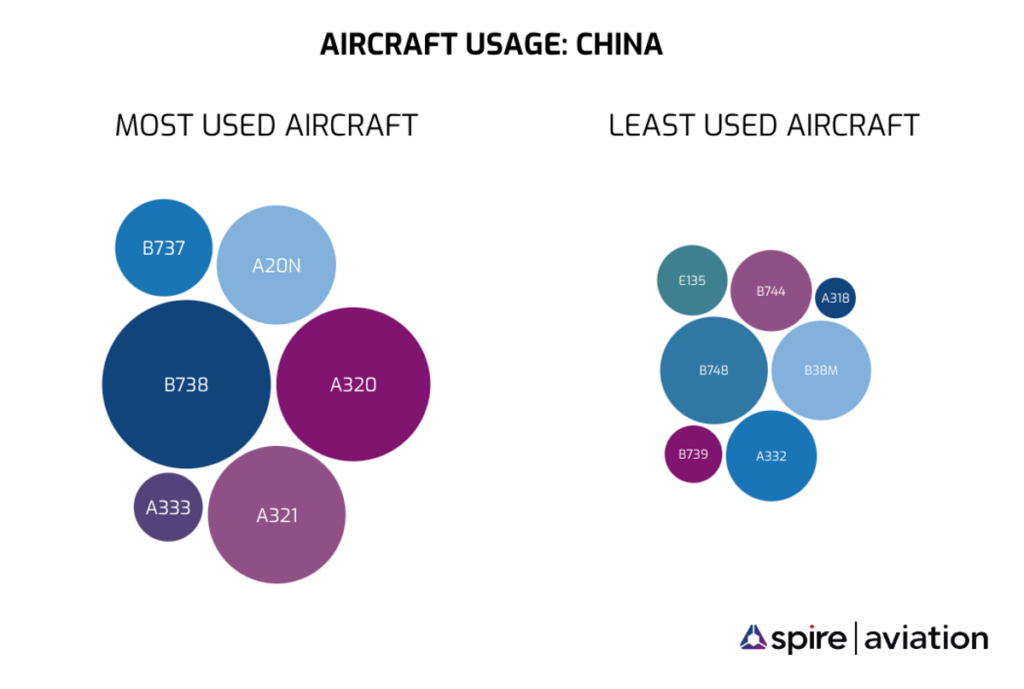
When we delve more into the differences in the aircraft used based on the number of flights operated by above identified top Chinese airlines, we noticed the Airbus popularity. Among top aircraft utilised by the Chinese operators is the Narrowbody twin engines A320 family used my all four airlines (Air China, China Southern, China Eastern and Shenzhen Airlines), as well as Boeing 738 operated by all five airlines. Among the least used aircraft types we can find Widebody aircraft like B747, medium to short range twin jets like B38M and A318.
Looking at the graph, the size of the bubble represents the ranking of the aircraft among top identified aircraft types used by Top 5 Chinese operators, meaning the smaller bubble among the least used aircraft type represents the aircraft with the least flights and vis-a-versa for the most used aircraft type. The smallest bubble represents the aircraft type with the least flights among all the most used aircraft.
China Fleet Technology
China’s transition from Old Tech to New Tech has been gradual. This is attributed to a slower return to widespread air travel following Covid-19 and trade agreements between the US and China. It is believed that Boeing retains c. 85 aircraft as inventory intended for Chinese operators. Looking at the Top 5 Chinese operators, all of them have orders for Boeing 737 MAX aircraft, yet. more recent deliveries are dominated by Airbus aircraft; Airbus also announcing a second assembly line in Tianjin this year to bolster production is perhaps another blow to Boeing in the region. It has been well documented that China has been slow to resume imports partly due to political tensions with the US impacting Boeing aircraft deliveries into Chinese operators. The reactivating of already delivered 737 MAX aircraft in China has proved successful in 2023, however. A clear resumption of Boeing aircraft imports should mean some replenishment of Old Tech aircraft. The table below details the share of Old Tech aircraft versus New Tech aircraft 12 months apart in China.
China Top 5 Operators by Old Tech vs New Tech
| Aug-22 | Aug-23 | |||
| Operator | Old Tech Share | New Tech Share | Old Tech Share | New Tech Share |
| Air China | 73% | 27% | 71% | 29% |
| China Eastern Airlines | 84% | 16% | 80% | 20% |
| China Southern Airlines | 74% | 26% | 73% | 27% |
| Hainan Airlines | 76% | 24% | 77% | 23% |
| Shenzhen Airlines | 84% | 16% | 83% | 17% |
| Source: AviationValues (September 2023) | ||||
US fleet technology & utilisation
On the other side, the most used aircraft type among the Top 5 American airlines is a mix of narrowbody aircraft of Airbus and Boeing family serving regional and international routes. Over the past year, we notice a decrease in usage of A330 and A350 family as well as long range Boeing Dreamliner and Embraer.
Looking at the graph, the size of the bubble represents the ranking of the aircraft among top identified aircraft types used by Top 5 American operators, meaning the smaller bubble among the least used aircraft type represents the aircraft with the least flights and vis-a-versa for the most used aircraft type, the smallest bubble represents the aircraft type with the least flights among the all most used aircraft.
US Fleet Technology
With some exceptions, legacy US airlines such as American Airlines, Delta Air Lines, and United Airlines operate aircraft for the typical economic life of the plane. It is therefore unsurprising to see the share of Old Tech aircraft outweighing New Tech. Further, the transition from Old to New Tech aircraft is still in its onset, particularly in the Narrowbody market, and New Tech engine issues, supply chain delays, and consequent production delays, are extending the life of Old Tech aircraft. Additional coverage of US legacy carriers’ fleet trends, both now and historically, is analysed in AviationValues’ AV Analysis Week 32 “Delta Air Lines” for an optimised review of a US legacy carrier.
JetBlue Airways’ fleet transition has been gradual. In 2022 and 2023, it has had a mix of Airbus A220 and A321neo deliveries, totalling 11 and 8 respectively. Aircraft exits are attributed to Embraer E190s, and this will continue.
Observing the table below, the most noteworthy change 2022 versus 2023 year to date is that of Southwest Airlines, owing to its ramp up of Boeing 737 MAX 8 deliveries, and exits of oldest Boeing 737-700s. In 2023, AviationValues counts 72 737 MAX 8 aircraft delivered to Southwest Airlines, the latest of which was MSN 42685, on 30 September. This will be a continuing fleet trend for Southwest given its remaining backlog, as has already been alluded to.
US Top 5 Operators by Old Tech vs New Tech
| Aug-22 | Aug-23 | |||
| Operator | Old Tech Share | New Tech Share | Old Tech Share | New Tech Share |
| American Airlines | 84% | 16% | 81% | 19% |
| Delta Air Lines | 89% | 11% | 84% | 16% |
| JetBlue Airways | 88% | 12% | 84% | 16% |
| Southwest Airlines | 87% | 13% | 76% | 24% |
| United Airlines | 86% | 14% | 78% | 22% |
| Source: AviationValues (September 2023) | ||||
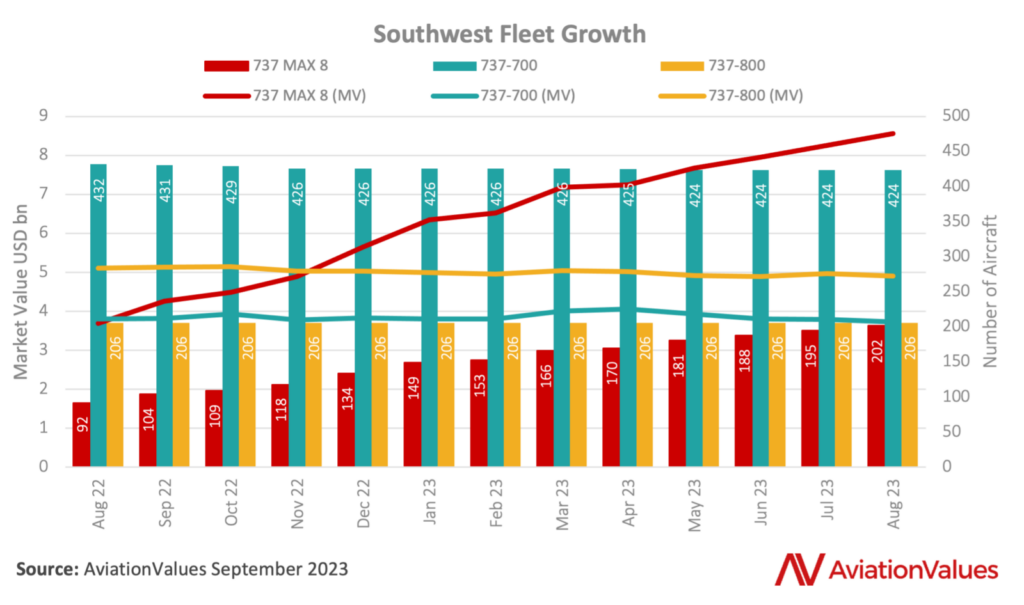
US spotlight: Southwest Airlines
The chart below details the Narrowbody fleet growth and Market Value change from August 2022 to August 2023 for US low cost operator, Southwest Airlines. The chart reveals that Southwest is inducting 737 MAX 8 aircraft at a significant rate, and these brand new aircraft detail a significant increase in value, attributed to new delivery transaction values. As at October 2023, AviationValues expects new delivery 737 MAX 8 Market Values of c. USD 52m.
These 737 MAX 8 aircraft are displacing Southwest’s existing fleet of 737-700s which were delivered between 1997 and 2011. The majority of 737-700 exits have been for oldest vintages in the fleet; an expected trend. Upon certification of the 737 MAX 7, these aircraft will also replace 737-700s. Although if there are delays to the expected service entry of 2024 for the MAX 7, Southwest will continue to take 737 MAX 8s in its place to maintain its aircraft replacement and growth plan.
As for 737-800s, this is still a young fleet at the airline having delivered between 2012 and 2018. Early retirements are not expected nor is there an exit strategy. As for value performance, fixed age Market Values have been to the upside for the period August 2022 to August 2023, corroborated by AviationValues AV Analysis Week 33 “Are the 737-800s Still in the Game” which examines a five year old 737-800, equivalent to the last of Southwest Airlines’ 737-800 aircraft received. Since this publication, there is enough anecdotal evidence to suggest this upward Market Value trend could continue.
China spotlight: Hainan Airlines
Looking again at China, the following charts detail the Narrowbody and Widebody fleet growth and Market Value change from August 2022 to August 2023 for Chinese operator Hainan Airlines. Specific to Hainan Airlines, and not subsidiaries, there have been no aircraft deliveries since 2019. Instead, there have been aircraft exits. The most surprising exit was that of its Airbus A350s, with end users such as Iberia, Fiji Airways, and South African Airways.
As recently as late August, two ex-Hainan Airlines A350-900s, Manufacturer Serial Number (MSN) 251 and 260, transacted between EMP Trading (seller) and KGAL (buyer). The aircraft will be serviced and managed by GOAL Aircraft Leasing on lease to Fiji Airways. The equivalent Market Value at sale close, relevant to the transaction price of the aircraft, was USD 112m per aircraft.
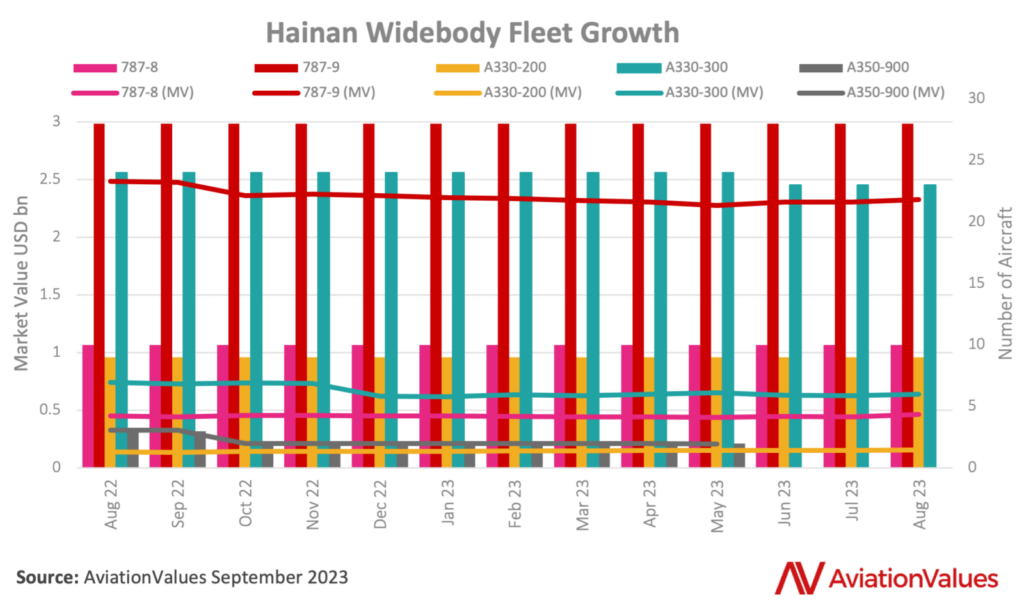
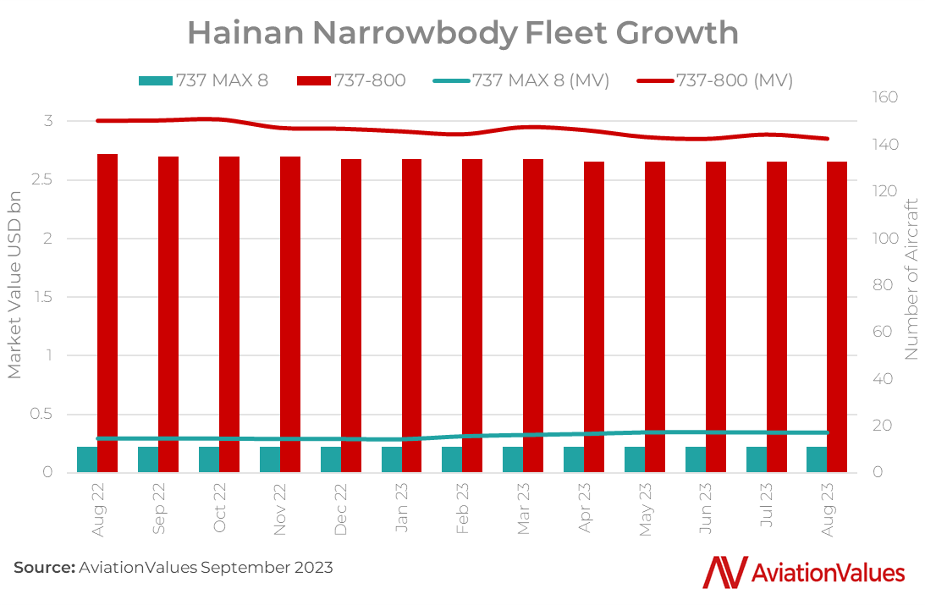
Narrowbody exits have not been prevalent in 2023. There were some lease returns of 737-800s in 2020 and 2022, with a subsidiary transfer in 2023. Given recent restructuring efforts which saw Liaoning Fangda Group Industrial take a controlling share of Hainan Airlines, a period of fleet stability appears evident.
This is supported in the charts by limited fleet change, and gradually decreasing overall fleet Market Value totals.
Liaoning Fangda Group Industrial has set a long term strategy to grow Hainan Airlines and subsidiary fleets to 1,200 to 1,300 aircraft by 2035, which includes a medium term strategy of 1,000 operational aircraft by 2029. These fleet growth ambitions corroborate both Airbus and Boeing’s long term fleet size projections for the region. If this reported strategy is accurate, a large order will be due by Hainan Airlines and its subsidiaries.
Findings & Conclusions
Summarising the direct data comparison of both the Top 5 US and Chinese aircraft across different parameters, we identify some clear trends and future considerations:
- Chinese international flight activity has seen a significant rebound in 2023 after stringent measures, reaching over 41,000 flights in July, a fourfold increase compared to the previous year. China’s domestic flight sector faced initial challenges but increased by 53% after the removal of internal restrictions.
- The US maintained stable international flight density, with over 121,100 flights per month, while domestic flight operations remained relatively stable, surpassing 600,000 flights per month by March 2023.
- Both countries focused on reestablishing or strengthening domestic and regional connections in their route landscape
- China primarily added new domestic and regional routes, with some international routes to key destinations like Dubai, Moscow, and London.
- The US added regional connections to Montreal, Italy, Japan, the Caribbean, and Peru and visibly strengthened domestic connectivity.
- Chinese airlines are not receiving new delivery Boeing aircraft
- This is impacting the number new aircraft entering the respective airline fleets.
- Consequently, the total fleet Market Value has not seen the rise of the US airline counterparts.
- Boeing has remarketed aircraft originally intended for Chinese operators
- For all the airline fleets covered, Old Tech aircraft comprise a large share of young aircraft.
- These aircraft have not reached retirement age. For example, Southwest Airlines’ Boeing 737-800 fleet.
- The transition from New Tech from Old Tech is still in its onset, and there have been numerous entry into service challenges prolonging the life of certain Old Tech aircraft in operator fleets.
- New Tech fleet additions are supporting growth over immediate replacement.
- Following the grounding of the 737 MAX in 2019 and Covid-9, some US operators have had an influx of 737 MAX 8 and MAX 9 aircraft.
- This will continue but production barriers could exist for those operators’ awaiting certification of MAX 10 and MAX 7 aircraft.
- Boeing has recently employed a new President for its China business to strengthen relations.
- Airbus is expanding in China with a second Tianjin production line.
- Due to be active in late 2025.
- What will be the impact for Boeing and does the Comac C919 have an increased role to play alongside Airbus at the expense of Boeing in China?
Whilst new deliveries of New Tech aircraft have been substantial, certain events, technical fleet challenges, and the age of the existing Old Tech fleet, have meant a slower transition. In an inflationary environment pushing up the cost of new delivery aircraft, technical challenges with them have caused increased demand, and ultimately, pricing for the Old Tech equivalents. In the US, could this be exacerbated should further delays be encountered for Boeing 737 MAX 7 and MAX 10 aircraft programmes? In China, can growth be sustained with existing orderbooks and constrained future delivery slots out to the end of the decade given a Boeing hiatus?