The Next Big Thing in Analytics (and a Free Trial to Get You Started)
 Written by
Maureen Thom
Contributing editor
We hosted a webinar last month launching our newest tools to help Maritime companies automate decision making, identify patterns, and keep all of their data in one place. We listened to your feedback from the webinar and for a limited time are offering a free trial of Spire Analytics. Our guided onboarding makes it easy to get started.
If you, like many of our customers, are looking to get better results and actionable insights from your data, we have a new tool for you. Spire Bridge and Spire Analytics deliver data in a convenient dashboard that can help you increase revenue, deliver superior customer service, improve safety, and optimize your operations. It’s one place for all of your data so you can get a complete picture of the data you have and see what you’ve used.
Spire Analytics was created to combine all of Spire’s data in one place and build actionable insights based on this data. Spire Bridge was created to provide our customers with an engagement portal; one place to find account information, usage information, data sets, and more. Together, they provide the information required to build proactive management and high-level strategy planning.
Five Reasons to add Analytics to your tools today:
1. Create customized reports and alerts
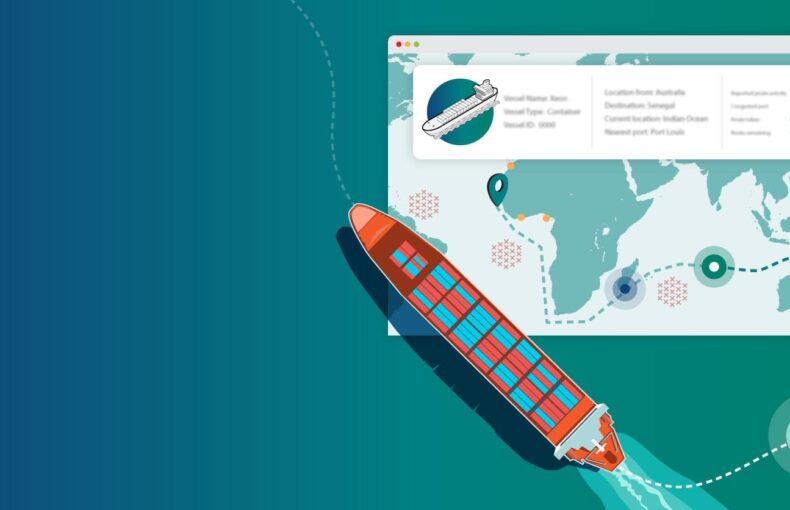
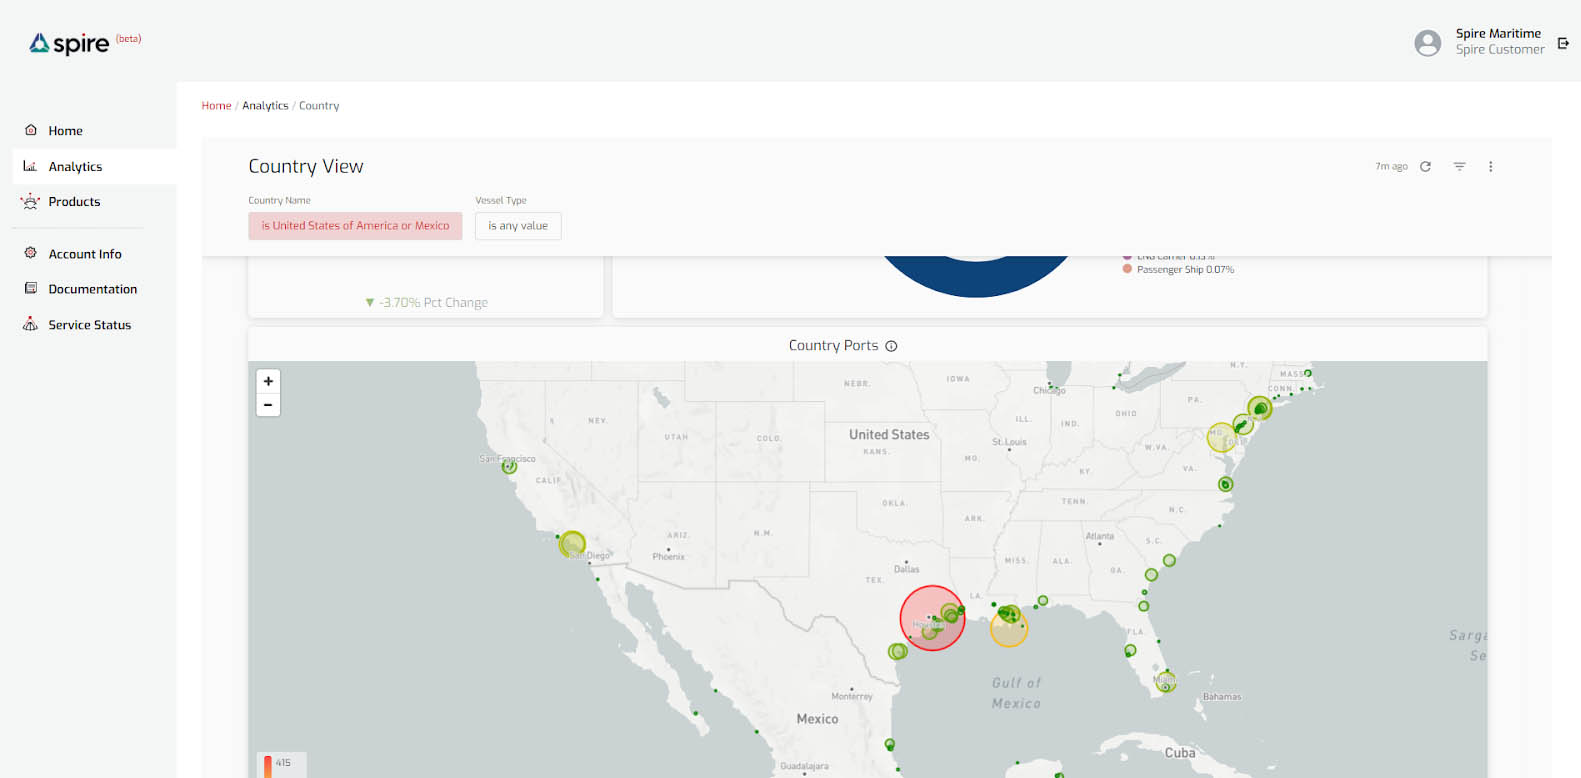
Custom data filtering lets you isolate the information that you need for decision making. It takes the clutter out of your data so you can immediately see what you’re looking for. See port events, average travel speed, and the number of active vessels in an area. You can customize your data for a time period, a region, and many other factors. Spire Analytics layers AIS and Maritime data together with analytics in a flexible tool so you can download all of the information you collect, and create alerts. In the alerts, you can request notifications to be sent when a port has a certain number of tanker vessels and many other events. This flexible, analytical tool ingests Spire AIS data, T-AIS data, cargo related data, and vessel data all on one platform that is accessible 24 hours a day, seven days a week.
This level of customization lets you visualize your most valuable insights, but also highlights patterns and aggregations that have an impact on your business. Spire Analytics enables you to interact with large volumes of Maritime data, filter, set alerts, and derive insights to create custom solutions and predict outcomes. It’s more than charts and numbers–it’s the data that tells the story of your business in an accessible way. The value of data can be measured by how well it solves your challenge or issue. Data and analytics need to be flexible and delivered in an easy to use dashboard that tells your story in a way that works for you.
2. Easy integration
All Spire Maritime solutions are easy to use and backed by 24/7 Engineering Support. Spire Analytics was built with ease of use in mind. The user interface is uncluttered and flexible, to go beyond delivering data in APIs. Your dashboard is truly a place to interact with Spire data and conduct in-depth data analysis. Spire Analytics delivers the “last mile” portion of data analysis that captures the actionable insights to drive better business outcomes. We’ve made them easy to use, put the data all in one place, and added the analytics to predict outcomes and automate decision making.
3. Identify patterns and anomalies
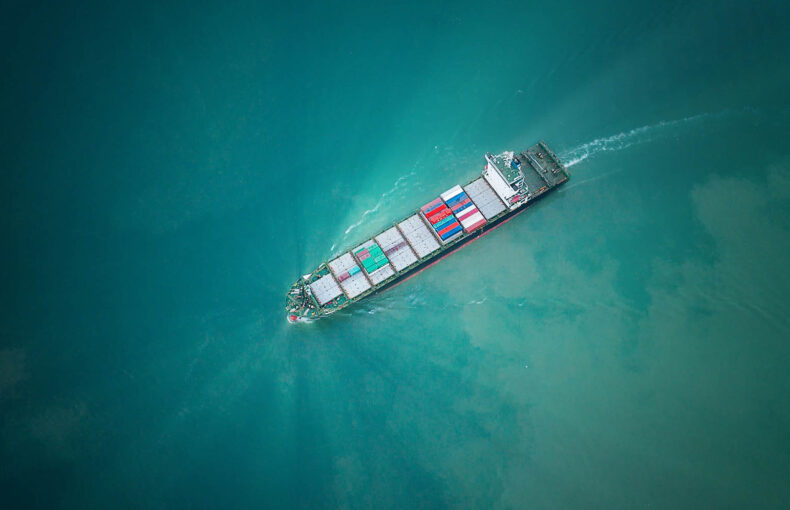
Whether you’re in shipping and logistics, finance, insurance, or trade, Spire Analytics has the power to help you discover relationships and empower your organization to achieve cost savings, route optimization, and decreased emissions. You can hone in on exactly what you’re looking for. Insurance professionals concerned about the recent spike in container losses can filter data surrounding these events to look for patterns to help prevent future losses or determine the root cause for the loss. You can use AIS data to track world trade and highlight anomalies. Spire Analytics enables you to visualize challenges, predict outcomes, and drive decision making based on event patterns before they impact delivery or result in a claim.
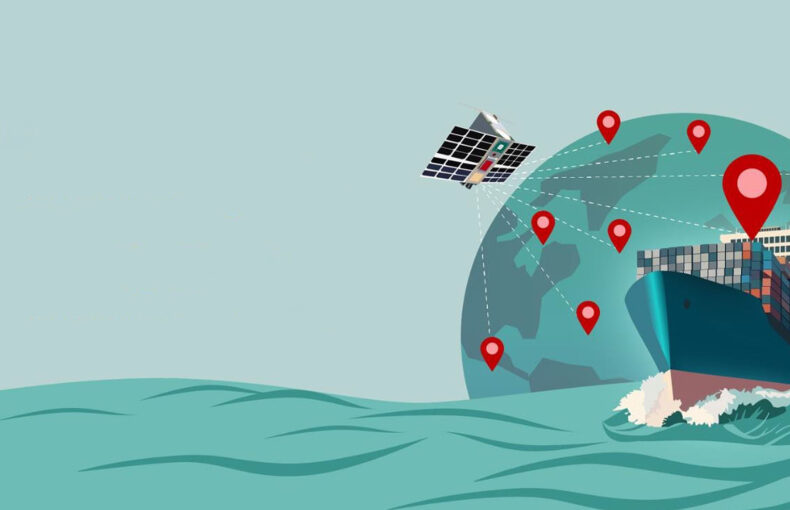
From voyage histories to weather events and wave data, Spire Analytics simplifies casualties monitoring, trade tracking, and arrival time estimating. Because we’re always adding to our satellite constellation, we can collect more data to help you build stronger cases.
4. Know the events that impact your business
When you are interacting with large volumes of data (we currently collect about 20 million messages a day using our constellation of more than 100+ low earth orbit, multi-use receiver satellites) you know your data is capturing the whole picture and you can make decisions based on this data with confidence.
The insights you derive create customized solutions and better predicted outcomes for your business and your unique challenges.
5. Ensure you’re achieving your goals
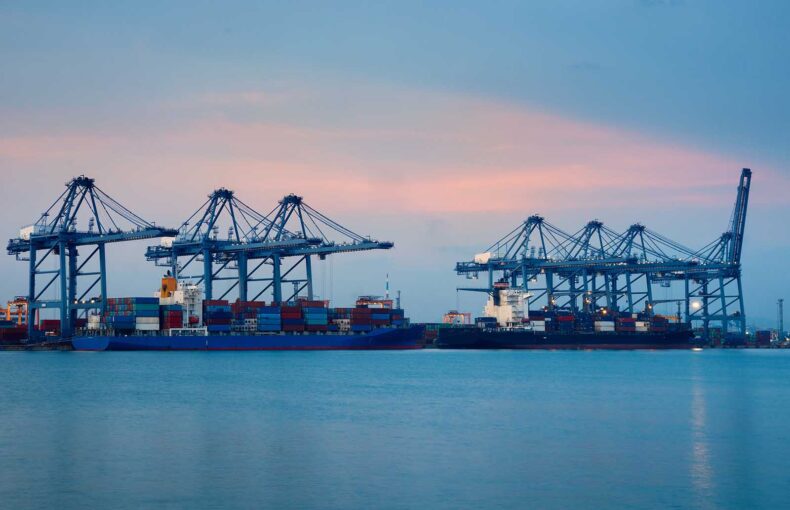
Spire Bridge and Spire Analytics give you the information you need to track how well you are achieving your goals. You can look at what worked well and what didn’t. You can analyze fuel consumption on specific routes, identify how long you were unloading at port, and determine how much reserve bunker fuel you need to have with you on a voyage. It’s more than fine tuning the ‘what’ and ‘when’ of your voyages, you can track profit and safety or analyze scheduling. Analytics are key to building organizations ready for the future of work. Whether you’re using real-time data or historical data, Spire Analytics lets you evaluate data at a glance on your customized dashboard and identify patterns and aggregations that impact the way you work every day.
Enable the data advantage
Get started with a free trial of Spire Analytics. We design and operate our own constantly evolving satellite constellation and predictive models, giving you unparalleled access to maritime data you can act on, now.