From telemetry to trajectories: How ADS-B telemetry is used to construct a global aviation emissions inventory
 Written by
Imperial College London analysed the climate impact of aviation-related CO2 and non-CO2 emissions, highlighting the significant spatiotemporal variation due to diverse air traffic activities.
The research is based on the ADS-B telemetry that plays a pivotal role in significantly advancing emissions evaluation in aviation. By providing precise and real-time data on an aircraft’s position, velocity, and other critical flight parameters, ADS-B enables accurate tracking and continuous monitoring of flights throughout their entire journey. This wealth of data contributes to a more comprehensive assessment of an aircraft’s fuel burn and emissions, allowing for the identification of specific areas where emissions reduction and optimization can be achieved.
The authors developed the Global Aviation emissions inventory based on ADS-B (GAIA) using historical flight trajectories obtained from Automatic Dependent Surveillance-Broadcast (ADS-B) telemetry and weather data analysis from 2019 to 2021.
“The introduction of ADS-B telemetry allowed us to track aircraft across different flight phases in a higher resolution, which addressed the limitations of existing emissions inventories and enabled us to create a more accurate aviation emissions model. The GAIA inventory captures the spatiotemporal distribution of aviation activity and emissions and as such provides valuable data basis for future studies examining the negative externalities arising from global aviation.”
Share on Facebook Share on Twitter Share on LinkedIn
GAIA’s multi-dataset approach to emissions inventory
The authors utilize global ADS-B telemetry that was collected by Spire Aviation using terrestrial and satellite receivers and combined it with historical weather data from the European Centre for Medium-Range Weather Forecast (ECMWF) and engine emissions data from the International Civil Aviation Organization (ICAO) to develop a global aviation emissions inventory. The dataset, named as the Global Aviation emissions inventory based on ADS-B (GAIA), contains 103.7 million unique flight trajectories between 2019 and 2021, the majority of which are jet aircraft flights.
Decoding the airborne pollutants of 2019
The study revealed that in 2019, over 40.2 million flights covered 61 billion kilometers. The majority of flight distance (92%) occurred in the Northern Hemisphere, with 63% in the northern mid-latitudes. Europe, the USA, and East Asia had the highest air traffic densities, accounting for 55% of the global annual flight distance. The North Atlantic and North Pacific flight corridors represented 4.9% and 3.9% of the annual distance traveled, respectively, while 52% of the globe had low air traffic density.
Consequently, this resulted in emissions of CO2, NOX, non-volatile particulate matter (nvPM) mass, and number emissions reaching 893 million metric tons, 4.49 million metric tons, 21.4 thousand metric tons, and 2.8×1026 respectively.
In terms of fuel consumption, global aviation burned 282 million metric tons of fuel in 2019, with the Northern Hemisphere accounting for about 92%. The US, Europe, and East Asia drained 47% of the annual fuel consumption. The regional distribution of fuel consumption differed from the air traffic density, with the US having a lower proportion of fuel consumption relative to its share of aviation activity. The North Atlantic and North Pacific flight corridors utilized more fuel than necessary for the distance flown, primarily due to the use of larger wide-body aircraft for long-haul transoceanic flights. Fuel consumption per flight distance flown in China was higher than in the US and Europe, likely due to airspace structure and fleet composition differences.
The impact of Covid-19 on air traffic density
Global air traffic activity experienced significant reductions during the pandemic, with the total flight distance traveled reaching a minimum in April 2020 (-76% globally relative to April 2019). The annual fuel consumption and CO2 emissions in 2020 and 2021 were lower than in 2019 (43% and 31% lower), resulting in lower mean distance-specific fuel consumption. Factors contributing to the lower fuel consumption rate included a lower passenger load capacity, increased short-haul flights, and increased usage of private jets.
The data also revealed significant regional variability. The highest year-on-year reduction in flight distance traveled was observed in the North Atlantic (-61%), Southeast Asia (-61%), and Europe (-59%), regions, which have a higher proportion of international flights, followed by Africa and the Middle East (-57%), Latin America (-52%), the North Pacific (-33%), the US (-31%), and East Asia (-24%). East China was the only region that recorded air traffic growth in 2020 compared to 2019 (+21%).
The global air traffic density in (a) 2019; and (b) April-2020, where air traffic activity was at a minimum due to the COVID-19 pandemic:
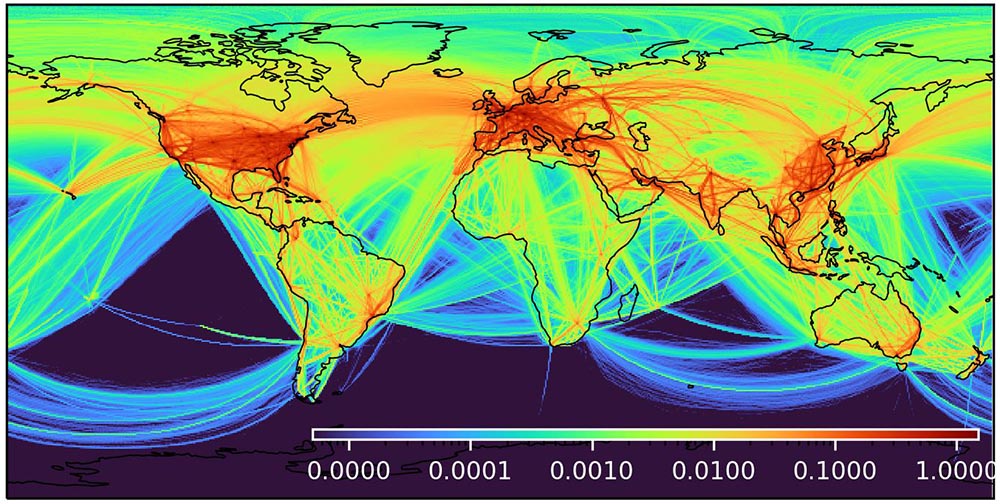
Air traffic density: 2019
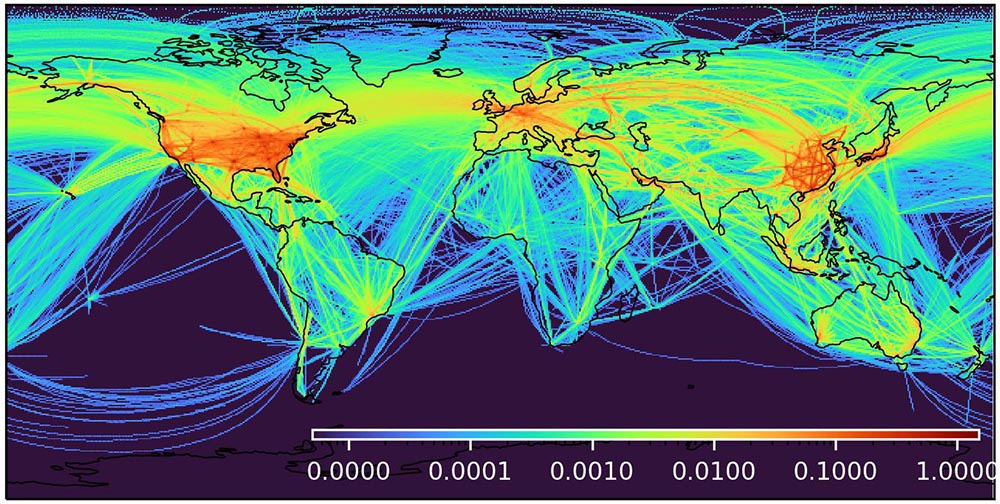
Air traffic density: April-2020
Teoh, R., Engberg, Z., Shapiro, M., Dray, L., and Stettler, M.: A high-resolution Global Aviation emissions Inventory based on ADS-B (GAIA) for 2019–2021, EGUsphere [preprint], https://doi.org/10.5194/egusphere-2023-724, 2023.
Teoh, R., Engberg, Z., Shapiro, M., Dray, L., and Stettler, M.: A high-resolution Global Aviation emissions Inventory based on ADS-B (GAIA) for 2019–2021, EGUsphere [preprint], https://doi.org/10.5194/egusphere-2023-724, 2023.
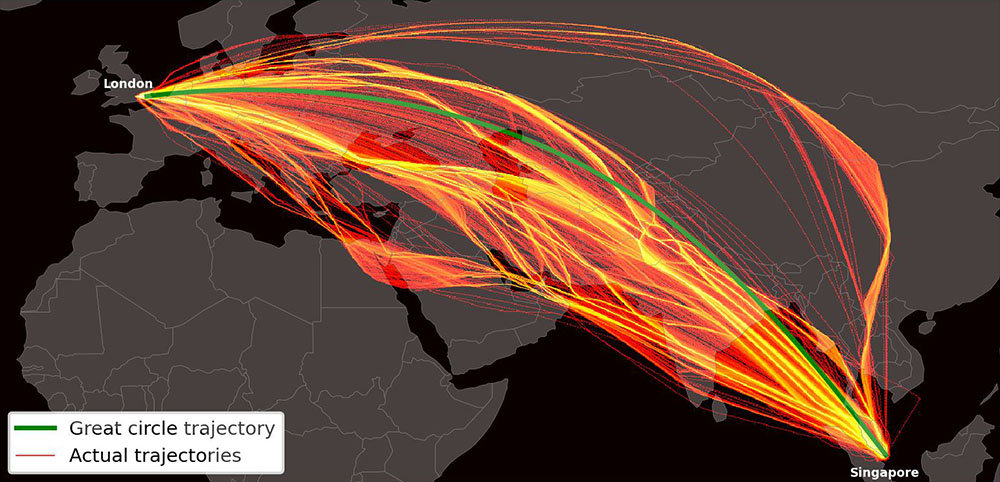
A detailed examination of a specific route highlighted the significant variability in flight trajectory, fuel consumption, and emissions. Factors such as aircraft type, passenger load factor, wind conditions, and engine settings played crucial roles in shaping these variations. Understanding these complexities is vital for understanding the spatiotemporal distribution of aviation emissions, which should lead to a more accurate quantification of the non-CO2 impacts caused by global aviation activity.
Learn how space-based data can help address sustainability challenges