4 Reasons why you should consider wave data
 Written by
Asma Toroman
Weather Product Marketing Manager at Spire
A look at how advanced wave and weather forecasts, including swell waves and wind waves, are being used to improve maritime analytics.
As is well known in the maritime industry, and as we’ve written about in some of our white papers and case studies, advances in data reporting and analytics are remaking the maritime landscape, just as is happening in many other industries. Some signs of the times:
- More maritime organizations are building their own custom data analysis software.
- More maritime organizations are hiring their own data scientists and machine learning specialists.
- More vessel technology companies are investing in e-navigation, autonomous solutions, and internet-of-things (IoT) technology.
In this blog post, we’ll look at a specific area where the power of data has been transforming the industry: wave forecasting.
Shipping companies and other maritime service providers are recognizing the need for more precise wave forecasts to add value to their operations and services. And to meet that need, data providers are striving to accumulate detailed, high-resolution wave data and to offer easy-to-use APIs with helpful built-in functionalities.
Spire Weather offers a highly valuable and truly global weather forecast enriched with unique data from Spire’s satellite constellation: more precise and easier to use forecast with customized variables for the maritime industry. Our maritime weather data pairs perfectly with maritime tracking. Maximum insight, minimum friction.
Wave problems and risks
First, let’s do a quick recap of the challenges waves present for vessels.
At the most basic level, waves, no matter the size, make maritime travel less efficient. Waves generate “wave load” (i.e.,they push against ships) and they create various ship movements that make travel less straight, and therefore less efficient.
And waves can cause damage. They can damage cargo by slamming containers around, and even by knocking containers overboard.
And of course large waves, like those found in the Black Sea or the South China Sea, can directly damage vessels and equipment, make vessels sink, and pose serious hazards to employees.
Now let’s look at some ways wave data is being used, and how that use is improving.
Wave forecasts for route adjustments
Maritime weather science and forecasting are improving. This is a result of 1) ongoing weather model improvements, and 2) advanced machine learning technology becoming more common (here’s a paper on machine learning being used to predict maritime fog). One use of more exact, up-to-date ocean/sea state forecasts, including wave forecasts, is using it to adjust routes. Wave forecasts can be incorporated into digital e-navigation algorithms to adjust and optimize ship course and speed based on predicted conditions several hours, days, or weeks into the future.
Spire waves height WMS and AIS with OpenLayers base map
Such programs may take into account a vessel’s characteristics and how that vessel responds to specific wave conditions. A 2016 paper about ship weather routing optimization algorithms says that models may take into account a “ship’s behavior and responses, its speed profile and fuel consumption when facing wind, waves, current and other environmental conditions.”
As e-navigation and autonomous solutions improve, digital application creators will demand better wave forecasts that are high resolution (more data points per earth surface area) and more frequently updated. And as the state of the art advances, there will be demand for algorithms for focused, niche applications.
Wave forecasts in simulations and digital twins
Advances in maritime data reporting and machine learning have led to improvements in the ability to run complex, accurate simulations of how vessels and equipment work.
One type of simulation is the “digital twin,” which is a computer model of a vessel or piece of equipment. Digital twins allow researchers to run experiments and simulations without putting the real-world asset, or the people and processes associated with it, at risk. For example, they might run a simulation that replicates years or decades of continual use to predict wear and tear.
Waves can be an important factor in these models. Maritime program creators can incorporate near-future wind and wave forecasts, combined with data-reporting sensors on vessels and structures, to predict how their assets will respond. With such models, they can answer questions like, “How will this specific offshore structure respond to these specific wind and wave conditions?” or “What specific conditions would have to develop to pose a danger for this specific vessel?” This technology has existed for decades, but it’s rapidly improving.
Wave forecasts can also be used in simulations to optimize fuel use and reduce emissions. One of our case studies looked at Oldendorff, one of the world’s largest dry bulk shipping companies, and how they used our weather and wave forecasts in a digital twin simulation. Their model aimed to optimize their fuel consumption, based on intelligent route planning, amongst other factors.
“People in the maritime industry still underestimate the value that good weather data can bring to their business”
Mike Pearmain
Chief Data Scientist – Oldendorff Carriers
Share on Facebook Share on Twitter Share on LinkedIn

Wave forecasts for public safety and environmental forecasting
Wave data, and weather data in general, can be studied and analyzed over longer time ranges, and used in predictive models. These uses have applications in shipping and transport, but also in many other areas, including public safety, environmental studies, and government studies.
One example of this: incorporating wave forecasts into models for predicting how an oil spill, or other chemical spill, might spread in bodies of water. For a specific example of this, see this 2018 paper Oil spill dispersion forecasting models, which describes how wave forecasts, and other kinds of data, were used to build an oil spill forecasting model.
Another example: At Spire, we are working on satellite-data-driven solutions that could enable more immediate detection of tsunamis by augmenting existing early-warning systems with newer sources of data, like GNSS radio occultation (RO) data.
Wave data for analysis of incidents
When things go wrong, historical sets of data, including wave data, can be used to get a better idea of what happened.
For example: if a piece of equipment failed, or was known to have issues under certain conditions, the routes that specific ships traveled could be studied and correlations might be found between certain wave conditions and certain kinds of wear and tear. Maybe a company’s ships that traveled routes that had extreme waves would show specific wear and tear issues, and it’s possible that could only be determined with an in-depth historical data analysis.
Wave data trends
In the maritime industry, shipping companies and other operators are demanding precise data, and demanding services that use that data for specific applications. Wave data is just one facet of maritime data, an important one, and wave data sources and algorithms will continue to improve.
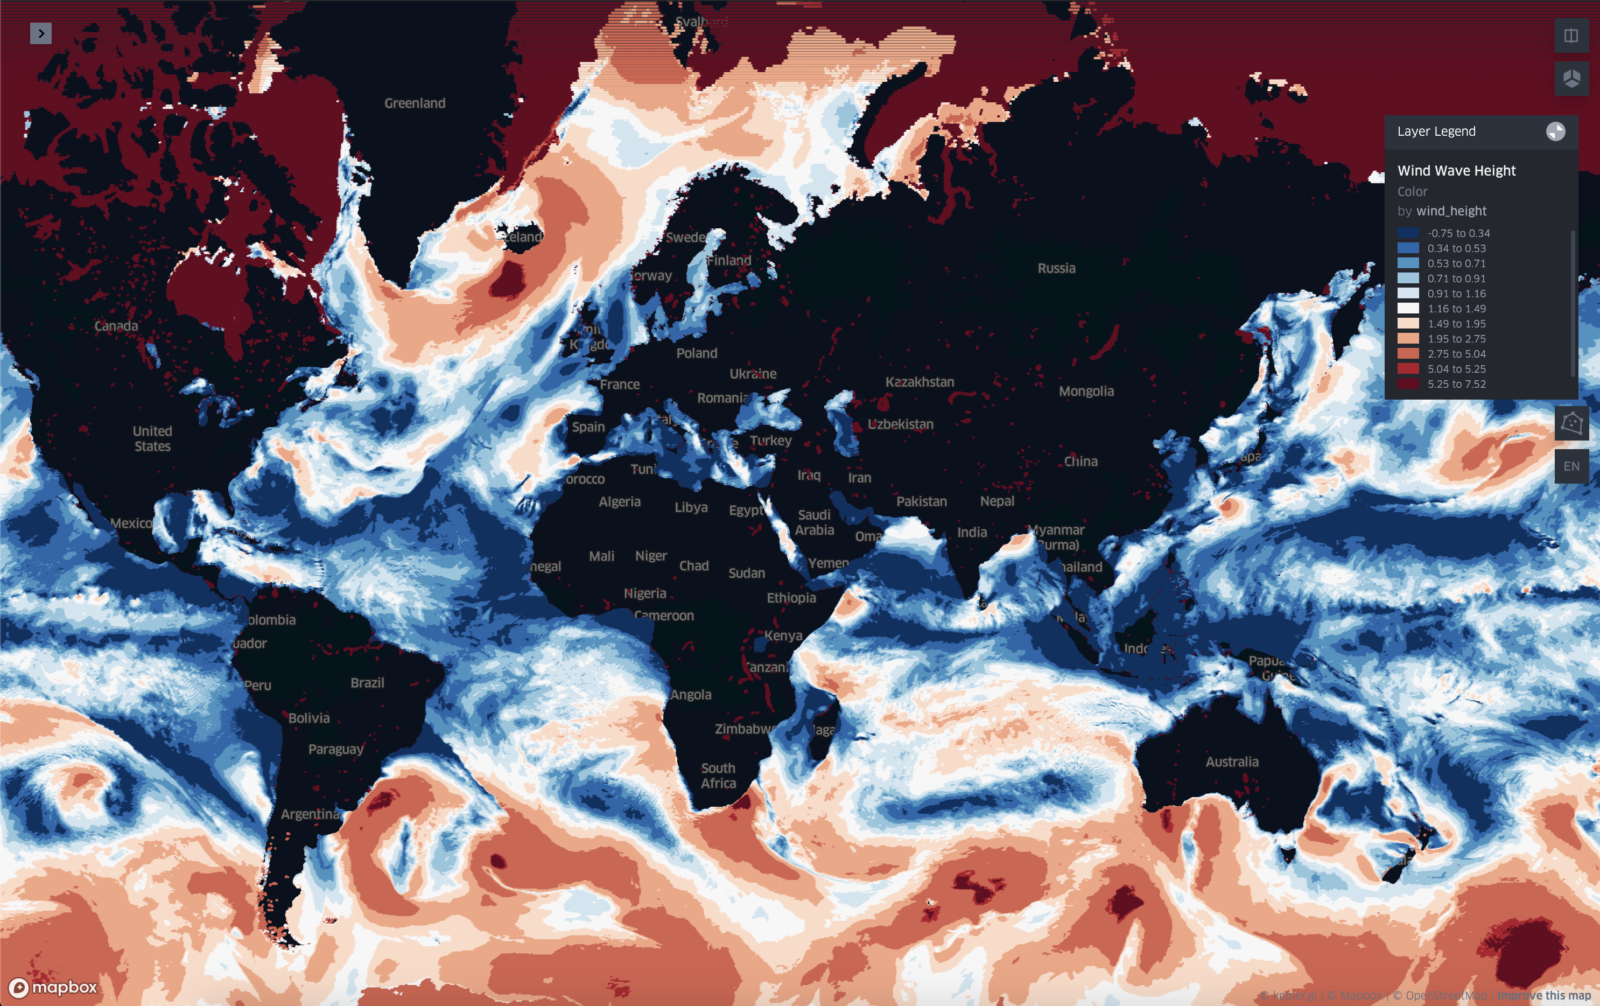
This image shows Wind Wave Height – Spire Weather
At Spire, we have several weather forecasting bundles focused for use by the maritime industry, and we’ve recently added wave forecasts to these bundles. Our maritime weather forecasts include:
- Sea surface temperature
- Ocean currents speed
- Ocean currents direction
- Significant wind wave height
- Mean wind wave direction
- Mean wind wave period
- Significant total swell wave height
- Mean total swell wave direction
- Mean total swell wave period
What’s next?
Do you want to get ahead of your competitors, and lead digital innovation?
You can start by integrating Maritime weather forecasts into your workflow, and we can help. After all, even in a digital world, partnerships and people are critical to unlocking data’s full potential.
Most organizations know that they need maritime weather forecasts, but few are focused on optimizing the quality of that data. Moreover, there is always room for improvement in how we make use of that data. With more data sources being used every year, and more Maritime services becoming digital, it is now paramount that we learn how to effectively source, manage, and use data.
You can book a free consultation with our team to discuss how you can add value using our advanced weather forecasts.