The quality of your AIS data feed: an evaluation framework
 Written by
George Facaeru
Maritime Sales Director at Spire Global
Learn how to better evaluate your AIS data feed and keep your data valuable and useful for your organization.
The 5 Vs and U: Spire’s framework for evaluating AIS data feed quality.
AIS data feed quality is the single most important factor to determining whether your data is valuable to you. The world is rapidly unlocking the value of data analytics for the benefit of the planet’s shared future. Data is the new oil of the economy. However, unlike oil which has a clearly defined value, how do we determine the value of data? For instance, the quality of an AIS data feed is clear once it has solved a challenge, but there is a lot of useless invaluable data to wade through before reaching this point. A valuable AIS data-lake can easily transform into a nightmare data-swamp if we fail to clearly define what makes the data itself useful and valuable.
Your AIS data feed needs to be easy to use. At Spire we collect large volumes of data from space to solve problems on Earth; we mine, refine, store and process AIS data feeds from Spire’s satellite constellation. Then, through our API, we add additional layers of data and make it easy for our customers to search through; cutting valuable time off of solving their unique challenges related to climate, supply chain in maritime, aviation, trade, security among others.
Data has value when it is fit for its intended use in operations, decision making or planning. This can include the optimization of crude oil trading, harvesting of wheat, distributing airport resources or anything else requiring decision making, operations, and planning.
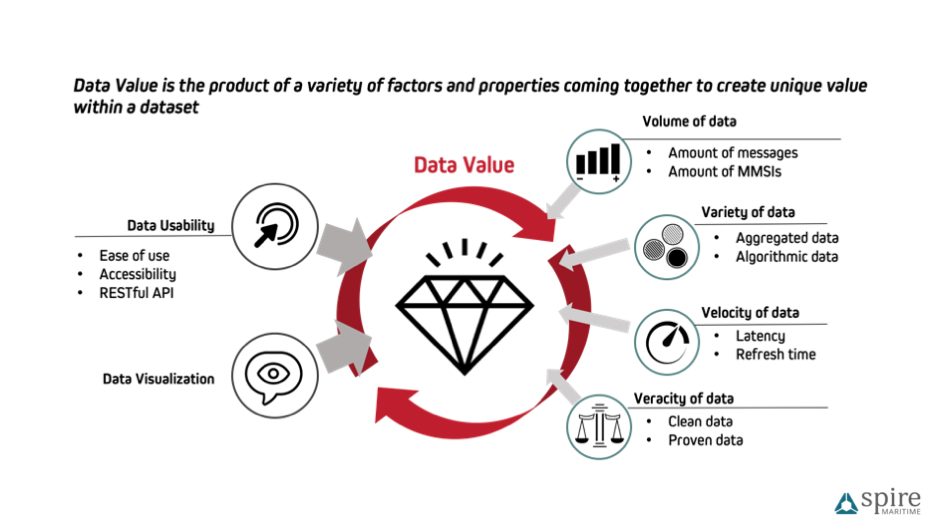
The value of you data feed increases as we get better at solving key challenges for our customers. When analyzing data we identify qualitative and quantitative variables that influence the data quality. How data creates value for you really comes down to these 5 metrics, at Spire we call these data value variables: The 5Vs and U”: Volume, Variety, Velocity, Veracity, Visualization, and ultimately data Usability.
By understanding these variables, you can optimize the data for your intended use and maximize its value and efficiency. Spire Sense AIS data feeds are powered by a robust satellite constellation that mines transmitted maritime AIS signals. This delivers around 40 million messages per day from more than 200.000 vessels, indicating their geographic positions and destination. So when measuring the variables in data analytics, we must take a pragmatic approach; let’s take a closer look at these variables within Spire Sense’s context.
Volume of data
For Spire Sense, this refers to the number of AIS messages received or the number of vessels tracked within a defined period. While Volume of data is an easy and obvious variable to compare data, volume does not take into account latency, duplicates, false data, therefore, it is not a definitive way to measure value.
Variety of data
While the vessel location is at Spire Sense’s core, our API adds value by aggregating additional layers of data such as the ownership of the vessel, its dry weight tonnage (DWT), etc. Aggregated data can also include predictive data analytics that employs machine learning and weather patterns to deliver estimated positions and estimated time of arrival (ETA).
Velocity of data feeds
Speed and cadence are a common priority throughout most use cases. How often the position of the vessel is refreshed as well as the latency between the original transmission of the message and the time the data is usable are clear pain points when it comes to vessel tracking with AIS data feeds. Spire Sense bridges this gap using predictive data analytics and better data processing.
Veracity of data feeds
Many of us at Spire would argue that this is the most fundamental of all the data analytics variables. How “true” is the data? AIS data feeds by nature are cluttered, before being delivered it needs to be refined; “False” or misidentified vessels need to be removed, spoofed positions corrected and data verified by correlating one dataset with other datasets at different times. There is no single truth in data (and in life), however, Spire Sense API declutters and refines as much of it as possible to help you find solutions faster.
Data Visualization
This is not true of all data use-cases; when it comes to daily workflows, a lot of data will remain invisible. However sometimes, when it comes to decision making, visualizing thousands of data bits can help the data quality become more tangible. So, data visualization is also a determining factor for data value.
Data Usability
How and why the data is being used is of critical value to all customers. Accessibility is not an issue thanks to many modern technologies readily available; although some are much easier to connect, search, query or analyze than others, some are tailored to specific use cases. When it comes to usability, ultimately it comes down to ease and flexibility. With this in mind, Spire avidly favors working with modern RESTful API technology with clear documentation. Data has no value if you cannot access or use it how and when you need it.
Spire Sense combines this variables framework with customer feedback to drive improvements and invest in development. The qualities of data are measured with the 5Vs and will vary depending on customer needs and use cases.
Here are some of the ways in which we are using this framework to improve our Sense API daily:
Volume and Velocity
We continue to increase exponentially the number of active satellites and ground stations.
Variety and Veracity
Spire Maritime has a growing team of analysts and data scientists and is applying machine learning algorithms that enable faster data processing and delivery.
Data Usability and Visualization
We are expanding our maritime team with dedicated software engineers. This dedicated maritime solutions team will ensure regular updates and the launch of new API features.
We care deeply about using space data to solve problems on Earth. Without measuring the 5Vs and U, there would be no way to determine the value of our own data and our success.
What are your 5Vs and U?
Apply this framework to one of our free data samples
You can apply this framework to our data and measure its value yourself by downloading a free 24-hour data sample of all global positions.